Figure 1.
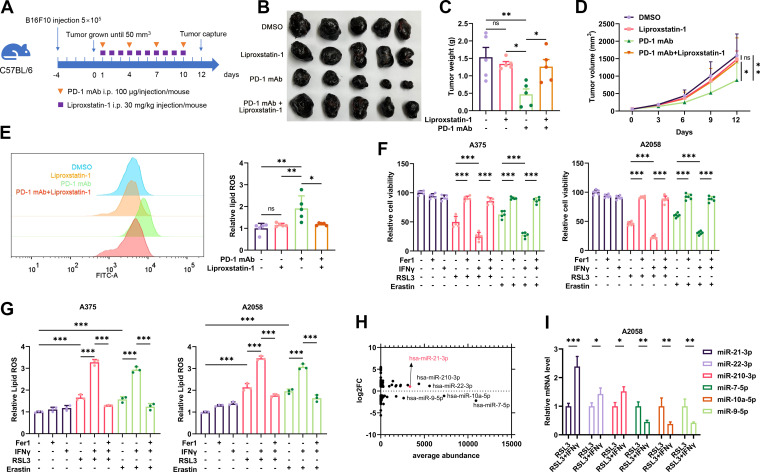
The expression profile of miRNAs in IFN-γ-potentiated ferroptosis in melanoma. (A) A schematic view of the treatment plan that C57BL/6 mice burdened with B16F10 tumors received anti-PD-1 antibody and liprostatin-1 treatment as indicated. (B-D) Images of isolated tumors from mice that received indicated treatment. Tumor volumes and weights in each group were calculated and displayed in (C) and (D). (E) Relative lipid ROS in isolated transplanted tumors with indicated treatment. (F-G) Relative cell viability and lipid ROS level in A2058 and A375 melanoma cells after indicated treatment with IFN-γ, RSL3, erastin and Fer-1. (H) The average abundance of the differentially expressed miRNAs related to (online supplemental figure S1D). (I) The relative expression of the most significantly differentially-expressed miRNAs after the treatment with RSL3 or RSL3 combined with IFN-γ in A375 melanoma cell. Erastin was used at 10 µM in both cell lines. RSL3 was used at 0.5 µM in A375 and 1 µM in A2058 cell line. Fer-1 was used at 2 µM in both cell lines. IFN-γ was used at 50 ng/mL in both cell lines. Data represent the mean±SD of triplicates. P value was calculated by two-tailed Student’s t-test. *P<0.05, **p<0.01, ***p<0.001. IFN, interferon; miRNA, microRNA; ns, non-significant; PD-1, programmed cell death protein 1; ROS, reactive oxygen species.

