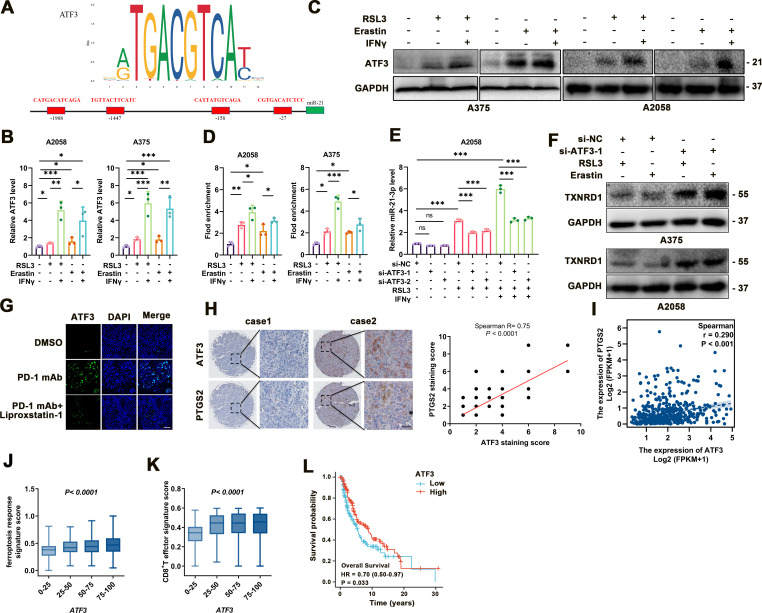
Figure 7.
ATF3 upregulation contributes to the increase of miR-21–3p in ferroptosis. (A) Transcription factor analysis of miR-21–3p promoter identified four ATF3 binding sites. (B-C) mRNA and protein levels of ATF3 in response to IFN-γ-potentiated ferroptosis. (D) Chromatin immunoprecipitation analysis of the enrichment of ATF3 to the promoter of miR-21–3p in IFN-γ-potentiated ferroptosis. (E) Relative level of miR-21–3p in IFN-γ-potentiated ferroptosis with or without the knockdown of ATF3. (F) Protein levels of TXNRD1 in response to ferroptosis inducers with or without the knockdown of ATF3. (G) Immunofluorescence staining of ATF3 in isolated transplanted tumors with indicated treatment. Scale bar=50 µm. (H) Immunohistochemical staining analysis of ATF3 and PTGS2 in TMA, with the correlation of staining scores displaying on the right. (I) The correlation between ATF3 and PTGS2 mRNA level in TCGA SKCM database. (J-K) The correlation between ATF3 mRNA level and ferroptosis response score or CD8+ T effector signature score in TCGA SKCM database. (L) Kaplan-Meier survival analysis of patients with melanoma between high tumorous ATF3 and low tumorous ATF3 level defined by the median level. Erastin was used at 10 µM in both cell lines. RSL3 was used at 0.5 µM in A375 and 1 µM in A2058 cell line. IFN-γ was used at 50 ng/mL in both cell lines. Data represent the mean±SD of triplicates. P value was calculated by two-tailed Student’s t-test. **P<0.01, ***p<0.001. DMSO, dimethyl sulfoxide; IFN, interferon; ns, non-significant; TMA, tumor tissue microarray; TXNRD1, thioredoxin reductase 1.

