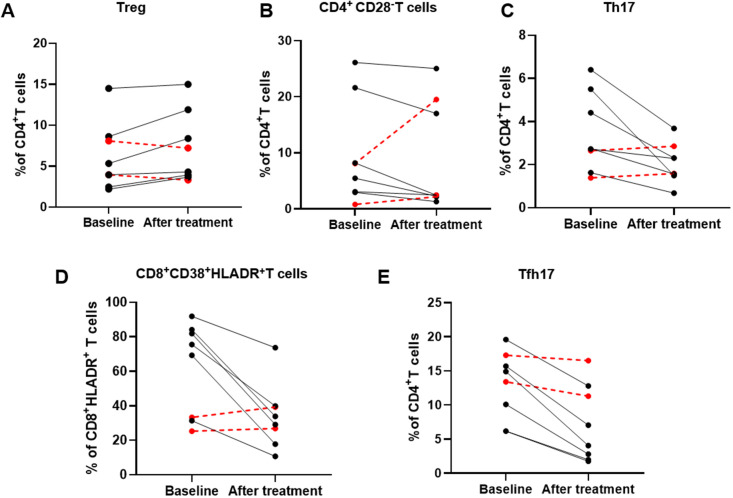
Figure 6.
The relationship between T lymphocyte phenotypes and renal response in eight patients with LN. The frequencies of Treg cells (A), CD4+CD28− T cells (B), Tfh17 cells (C), CD8+CD38+HLADR+ T cells (D) and Th17 cells (E) before and after treatment are shown. The black solid line represents six ln patients with complete renal responses, while the red dashed line represents two ln patients with impaired renal responses. ln, lupus nephritis.

