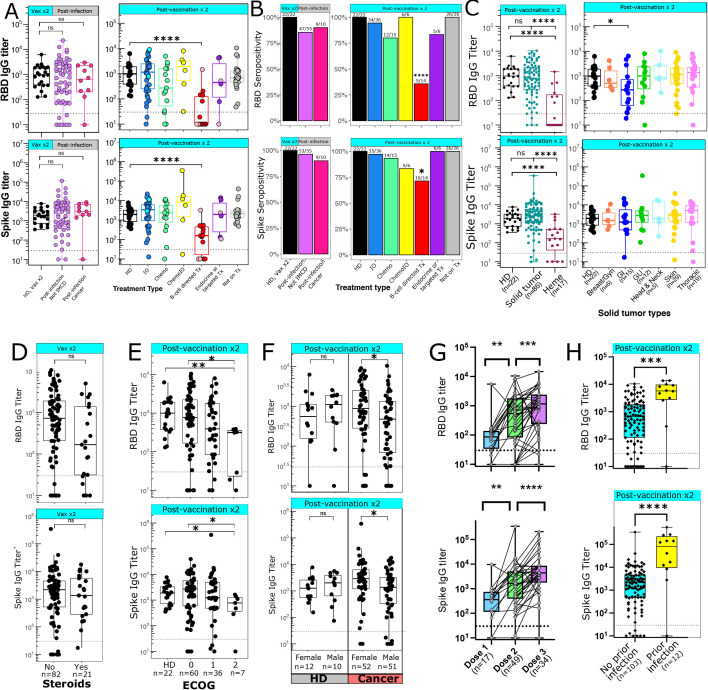
Figure 1.
Antibody generation after COVID-19 vaccination. (A) IgG antibody titers against RBD (top panels) and Spike (bottom panels) were measured after infection (left panels) or two vaccine doses (right panels). Dark blue=anti-PD-1 immunotherapies, light blue=non-PD-1 immunotherapies, pink=anti-CD20 antibodies, red=multiple myeloma or other B cell directed therapies, dark purple=targeted therapies, light purple=endocrine therapies. (B) Percentage of patients who are seropositive for RBD (top) or Spike (bottom). Numbers above each bar represent the number of seropositive patients out of the total number of patients per group. Data analyzed using Fisher’s exact test. (C) RBD (top) and spike (bottom) antibody titers after two vaccine doses grouped by cancer types. Solid tumors are broken down into individual tumor subsets in the right panels. (D) Antibody titers after two vaccine doses in patients who did (n=21) or did not (n=82) receive steroids within 1 week of vaccination. (E) Antibody titer after two vaccine doses by ECOG performance status. (F) Antibody titer after two vaccine doses by sex. Left panel shows HDs; right panel shows patients with cancer. (G) Antibody titers after 1, 2, or 3 doses of an mRNA vaccine. Samples from the same patient are connected with a line; data shown is from 55 distinct patients. Data analyzed using Wilcoxon matched-pairs signed rank test. (H) Antibody titers after two vaccine doses in patients with cancer with (n=12) or without (n=103) a documented COVID-19 infection prior to vaccination. Patients with a COVID-19 infection prior to vaccination were excluded from A–G. (A, C–H) Seropositive threshold is indicated with a horizontal dashed line in panels. Boxplots indicated median and 25th and 75th quartiles, with whiskers extending to minimum and maximum. (C–H) Number of patients per group is shown with x-axis label. (A–F, H) Each point shown represents a separate patient. (A, C–F, H) Data analyzed using Wilcoxon rank-sum test. *P≤0.05; **p≤0.01; ***p≤0.001; ****p≤0.0001. chemoIO, chemoimmunotherapy; IO, immunotherapy; ns, not significant; RBD, receptor binding domain; Tx, treatment; ECOG, Eastern Cooperative Oncology Group

