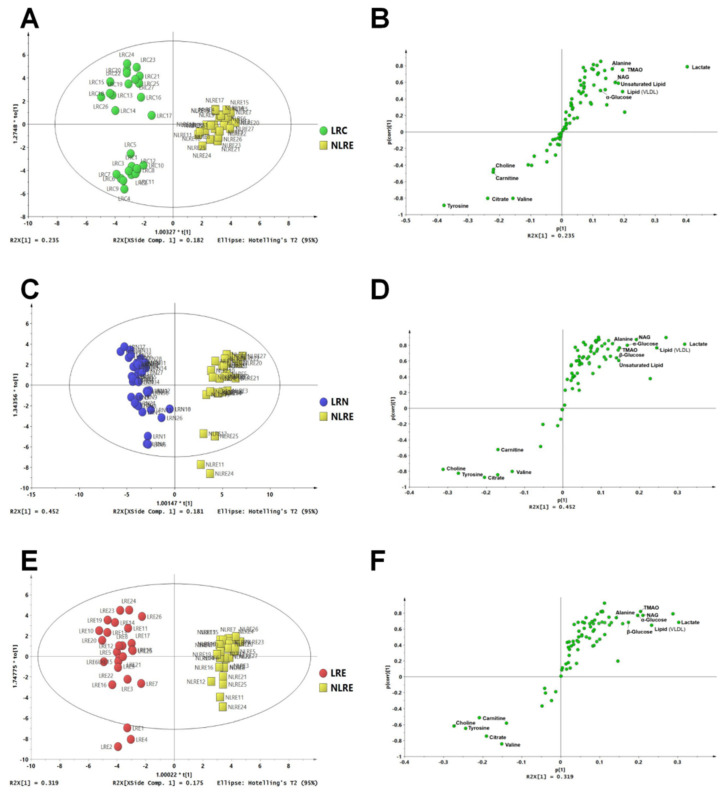
Figure 3.
Plasma metabolic profiles of participants from the longevous region and control region. OPLS-DA score plots (A,C,E) showing clustering of metabolites, and s-plot (B,D,F) showing identified metabolites. Comparisons between LRC and NLRE (A,B), between LRN and NLRE (C,D), and between LRE and NLRE (E,F) showing metabolites associated with longevity.

