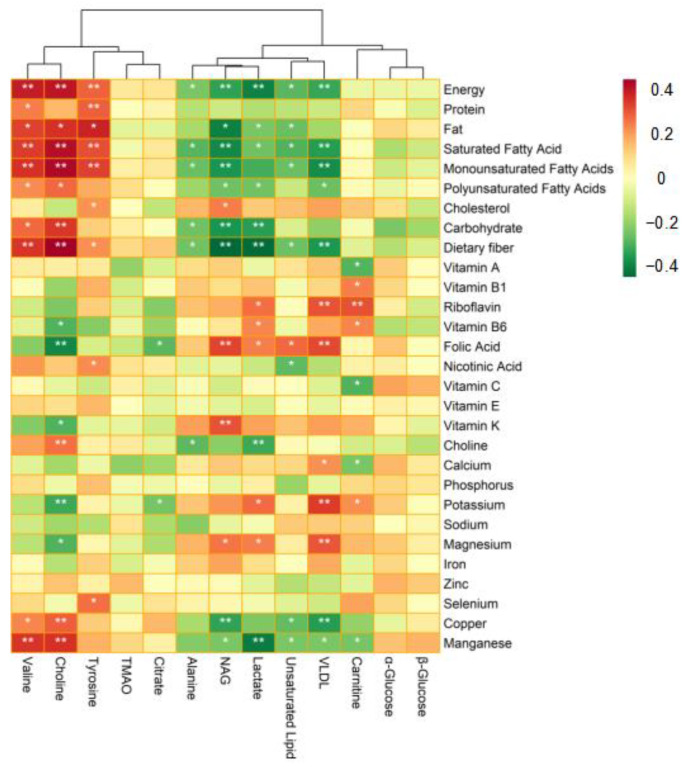
Figure 6.
Heatmap showing the Spearman rank correlations between nutrient intake and differential metabolites. Red color indicates a positive correlation, whereas green color indicates a negative correlation; * represents p < 0.05; ** denotes p < 0.01. Analysis was conducted after adjustment for age, gender, and BMI. Correlation coefficients between dietary fiber intake and choline (r = 0.431, p < 0.01), NAG (r = −0.412, p < 0.01), and lactate (r = −0.401, p < 0.01) metabolites were high.

