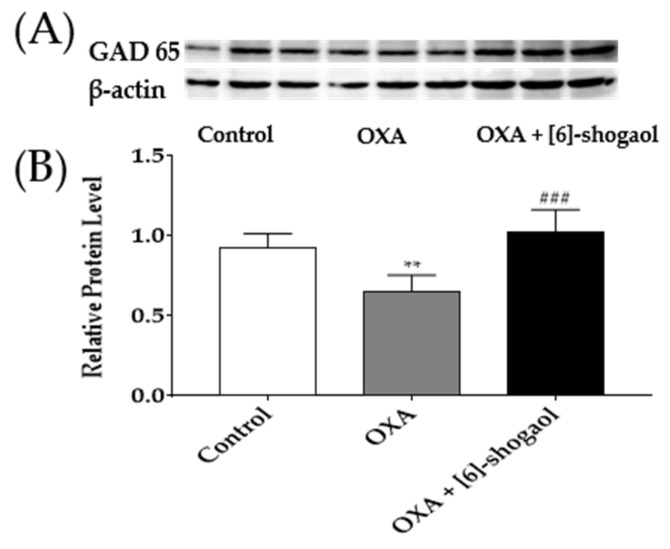
Figure 6.
GAD65 protein concentration in the lumbar 4–5 spinal cord segments following intraperitoneal injection of [6]-shogaol. GAD65 protein binding band density image (A). The density of GAD65 protein concentration was quantified compared to β-actin (B). Control group received 5% glucose. OXA and OXA + [6]-shogaol groups received oxaliplatin injection four days prior to experiments. Data are presented by mean ± SEM. Control: n = 6, OXA: n = 6, OXA + [6]-shogaol: n = 6. ** p < 0.01 vs. Control and ### p < 0.0001 vs. OXA with one-way ANOVA followed by Tukey’s multiple comparisons test.

