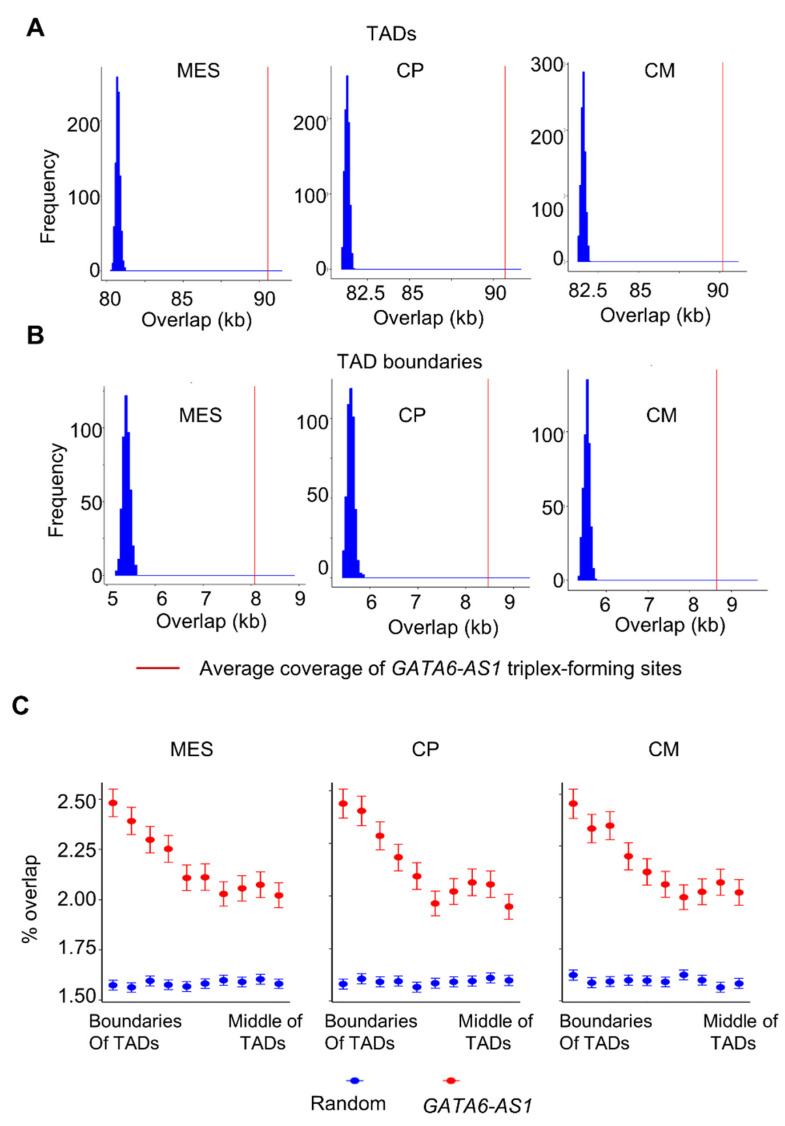
Figure 1.
Enrichment of lncRNA GATA6-AS1 triplex sites in specific regions in the context of 3D genome organization. The distribution of expected coverage (blue) compared to the observed coverage (vertical red line) in TAD domains and TAD boundaries are shown in panels (A,B), respectively. The x-axis and y-axis represent coverage (in kb) and frequency, respectively. (C) Enrichment of GATA6-AS1 triplex sites at different regions in TADs. A TAD was divided into 10 regions or bins based on distance from the boundary. The y-axis represents the fraction of the size of the bin that was occupied by GATA6-AS1 triplex sites (or a control set of randomized sites). The error bars indicate the standard error of the mean.

