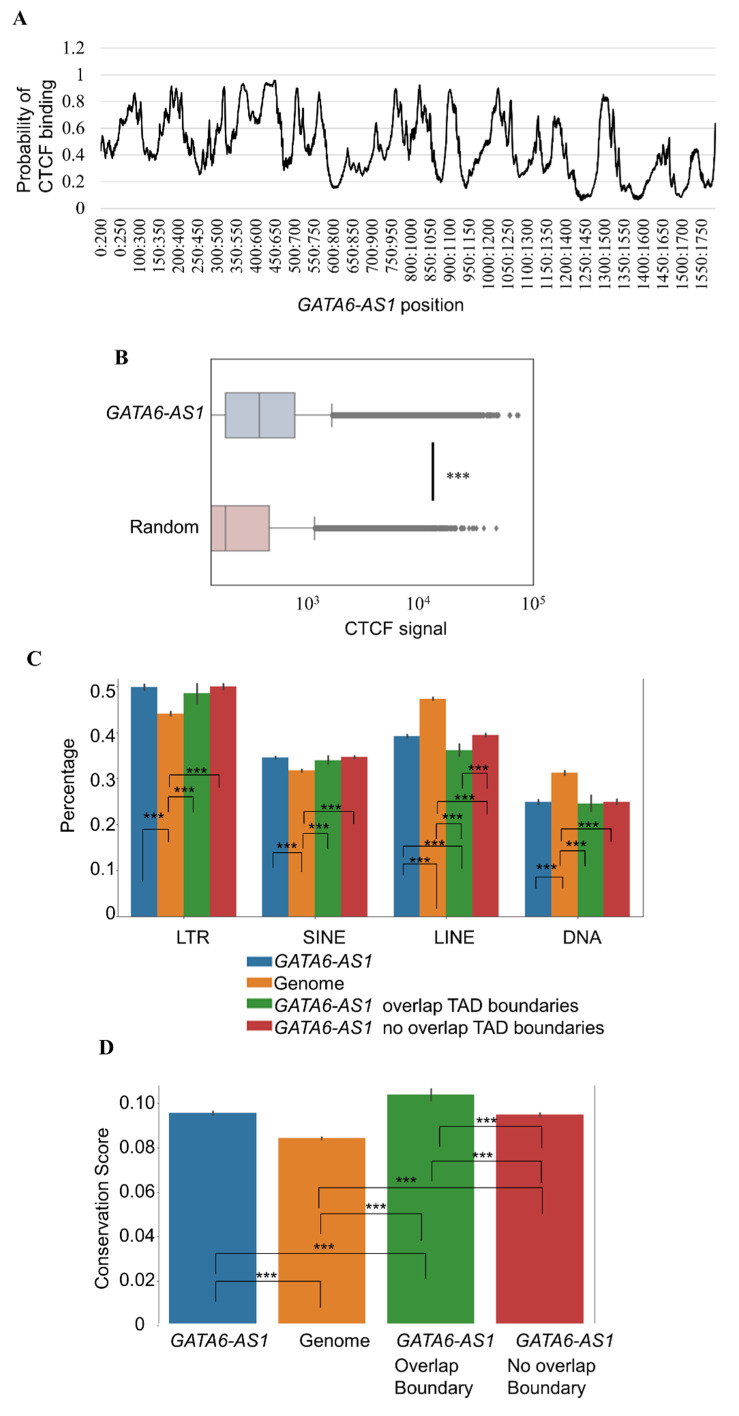
Figure 3.
Characteristics of GATA6-AS1 triplex sites in relationship to CTCF, repeat elements, and conservation. (A) The probability of binding of CTCF (y-axis) to different regions of the GATA6-AS1 sequence (x-axis) is shown. (B) Boxplots comparing the amount of CTCF signal at GATA6-AS1 triplex sites and a control set (genome). *** indicates p-value < 0.001. (C) Fraction (y-axis) of the length of GATA6-AS1 triplex sites occupied by four groups of repeat elements (LTR, SINE, LINE, and DNA transposons) is compared to a control set (genome). GATA6-AS1 triplex sites are further grouped into two groups based on whether it is associated with TAD boundaries or non-TAD boundaries. For each type of repeat element, six statistical comparisons were tested and only the ones which showed significant differences are marked as ***. (D) Conservation score per base pair (y-axis) is shown for GATA6-AS1 triplex sites and a control set (genome). six statistical comparisons were tested and only the ones which showed significant differences are marked as ***.

