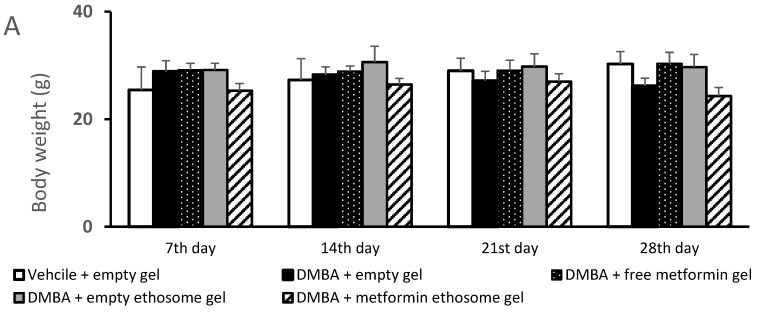
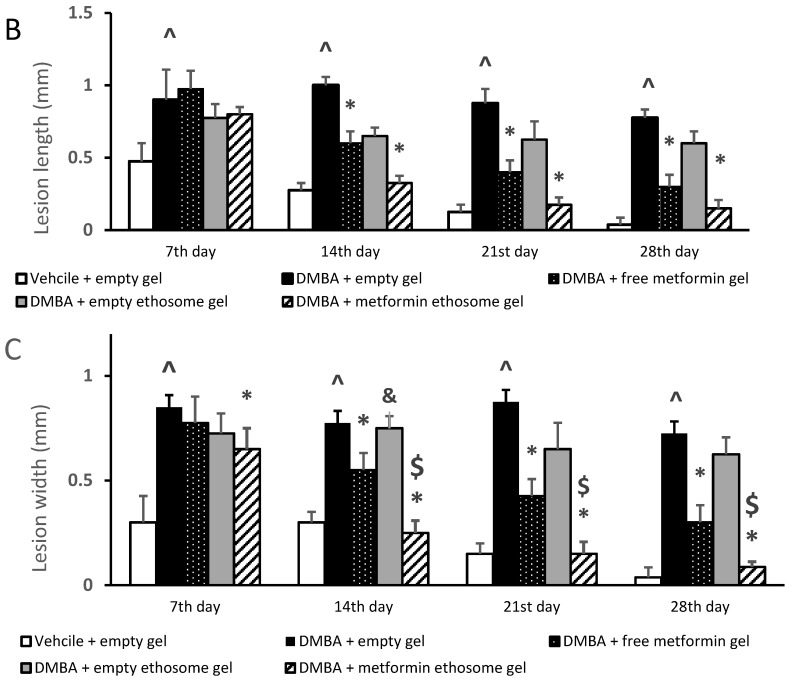
Figure 8.
Body weights and dimensions of the skin lesions in the experimental groups. (A) Mice body weights, (B) lesion lengths (mm) and (C) lesion widths (mm). Data were the mean ± SD and analyzed using one-way ANOVA, followed by Bonferroni’s pairwise comparison test (p < 0.05). ^: versus the vehicle + empty gel group, *: versus the DMBA + empty gel group, &: versus DMBA + free metformin gel. $: versus DMBA + empty ethosome gel.


