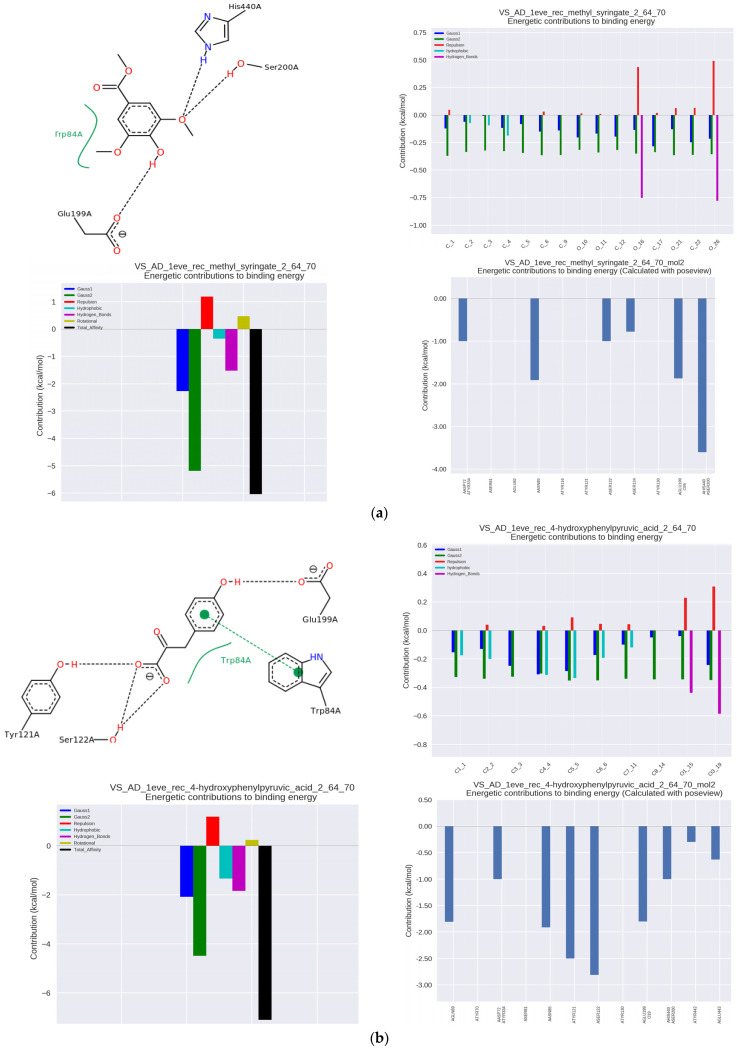
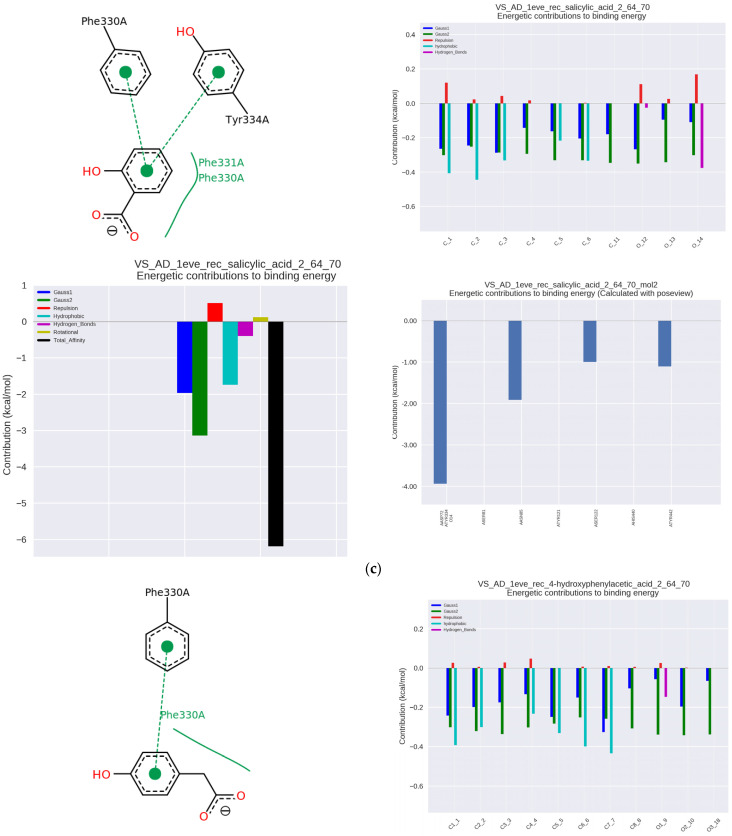
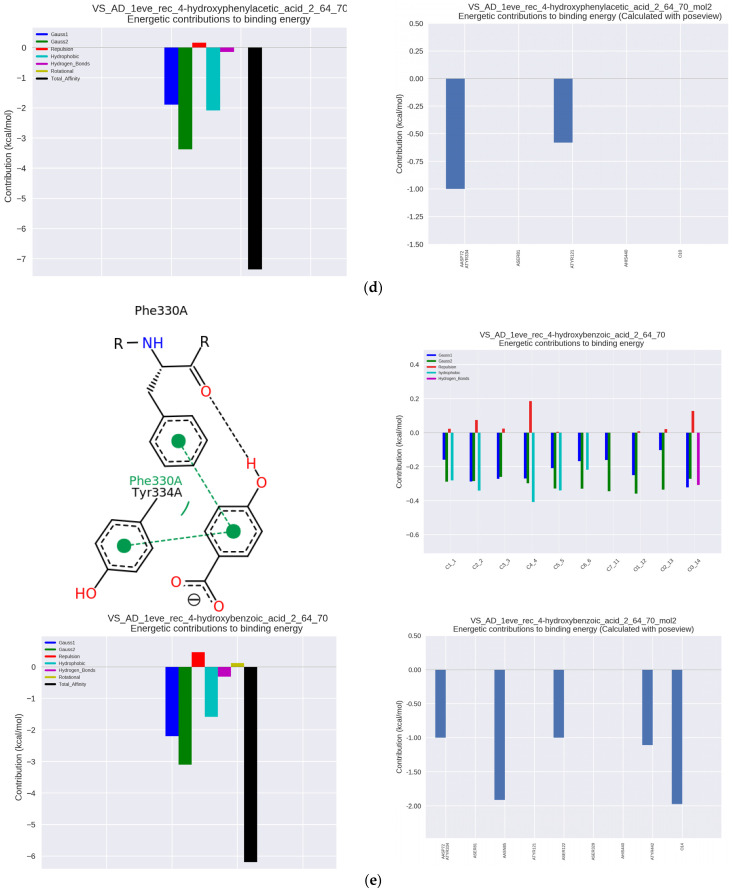
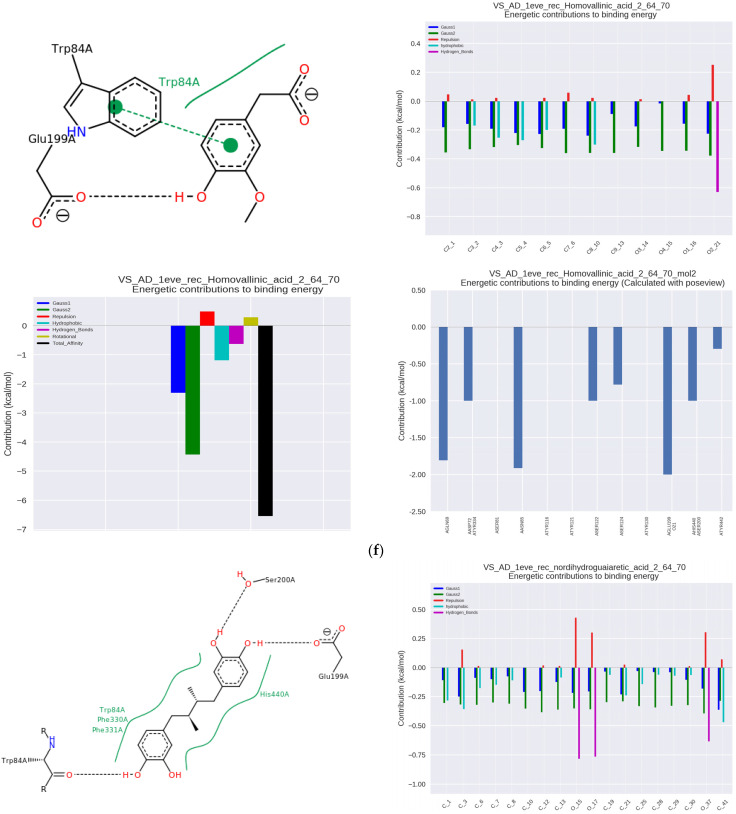
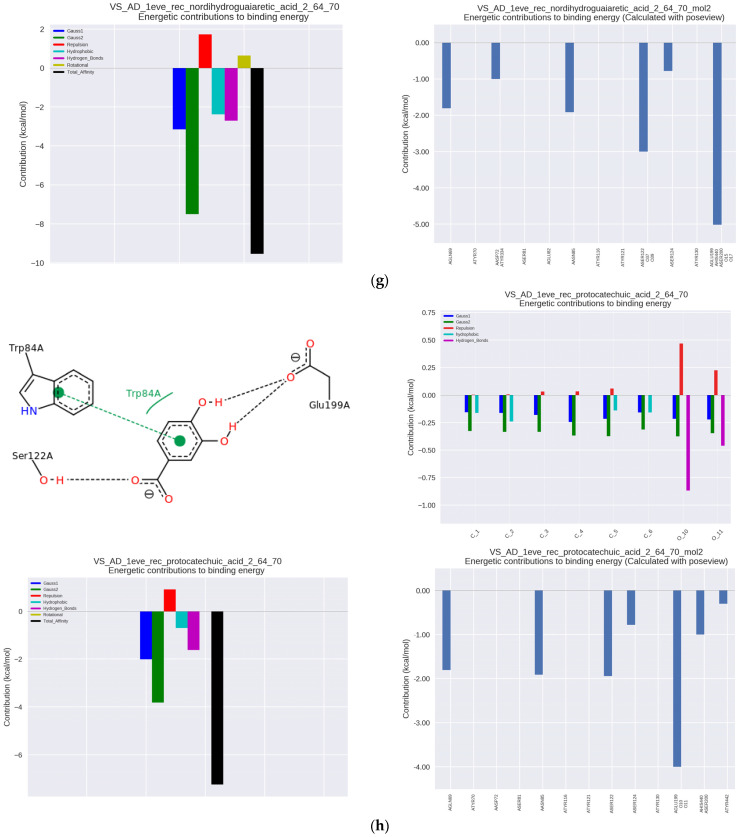
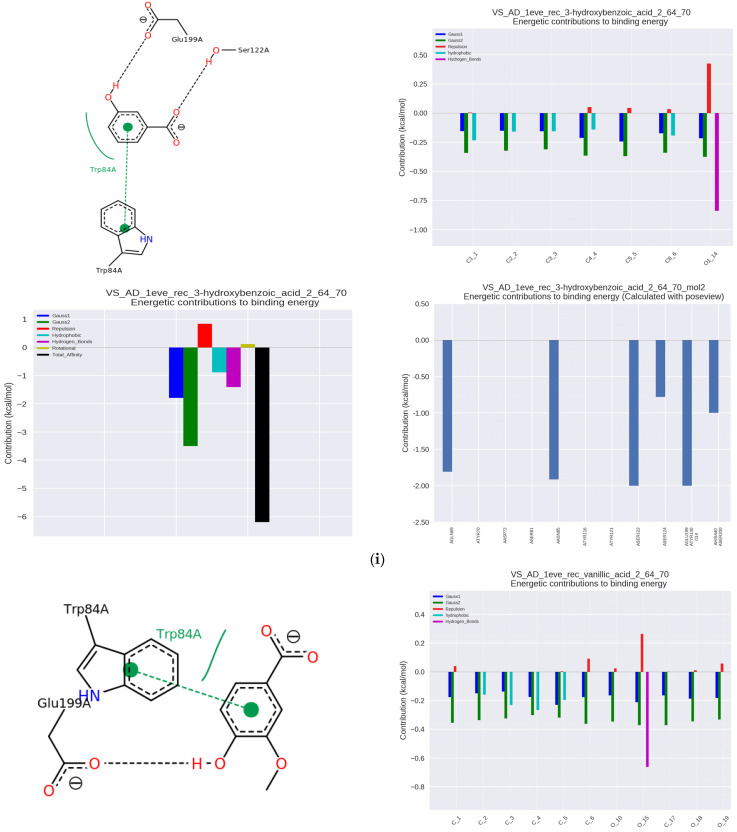
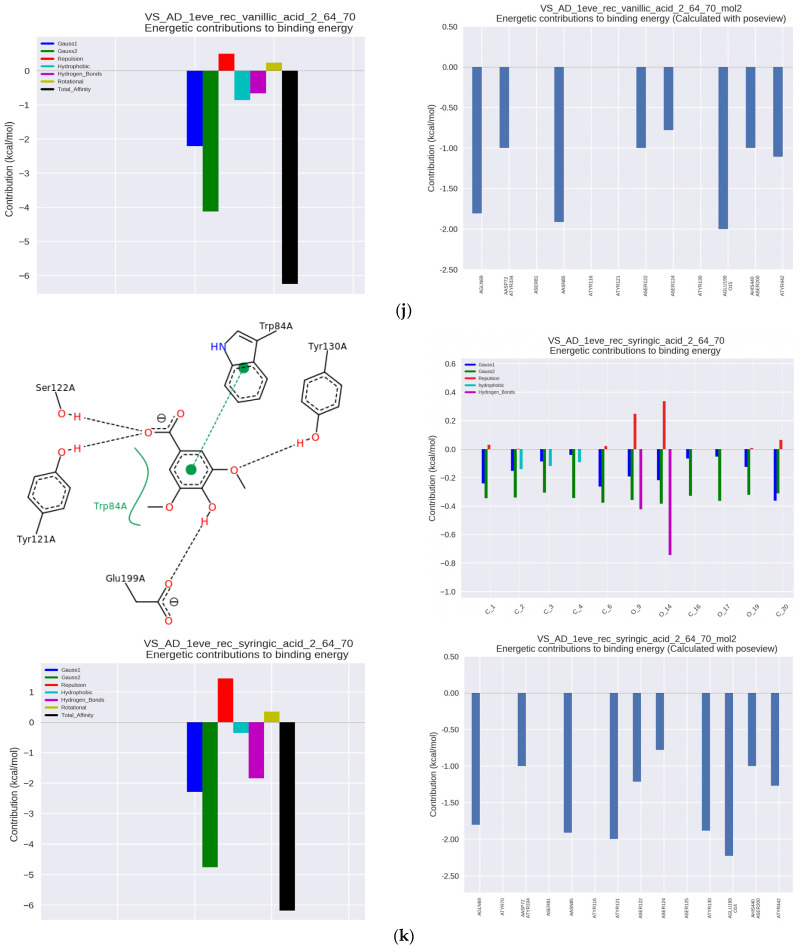
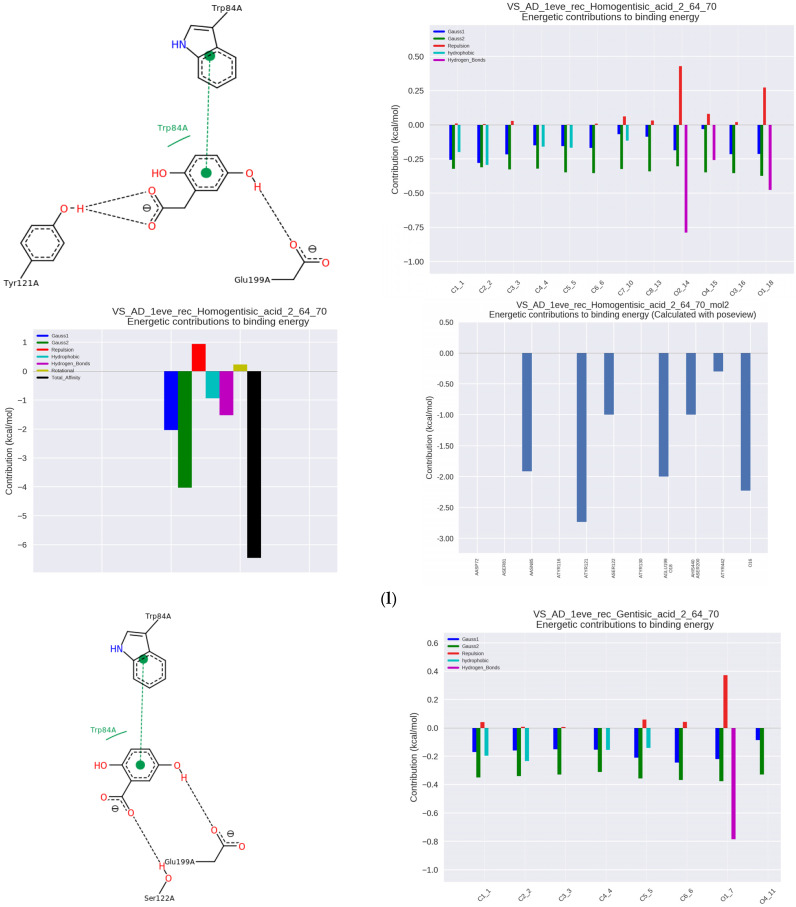
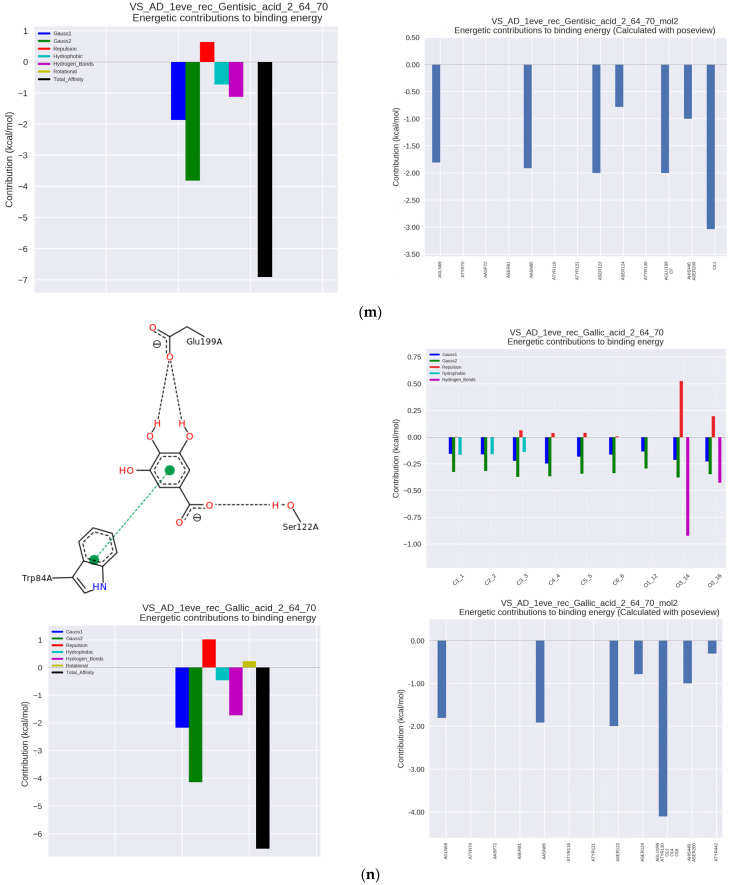
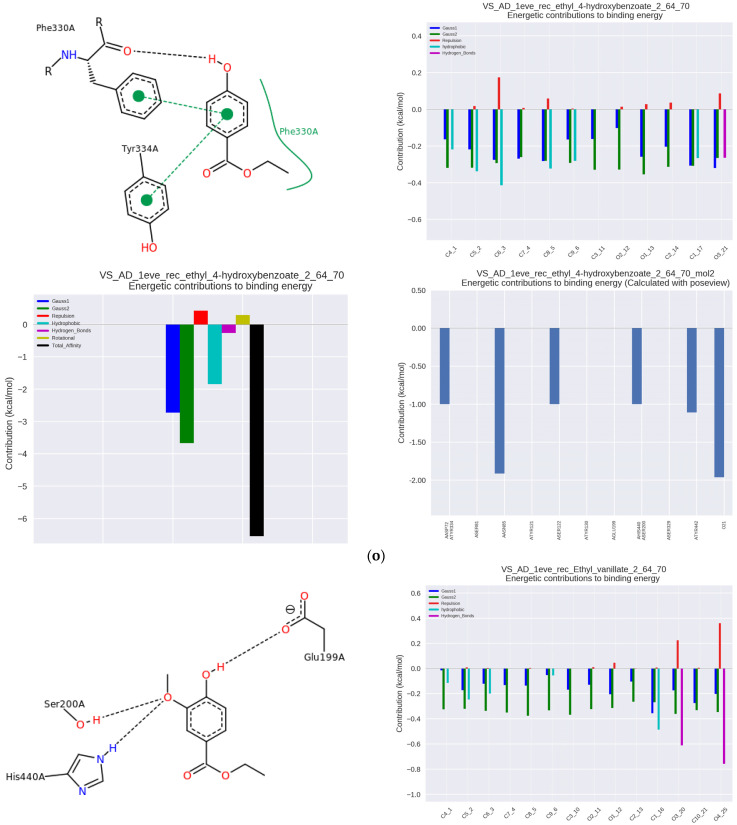
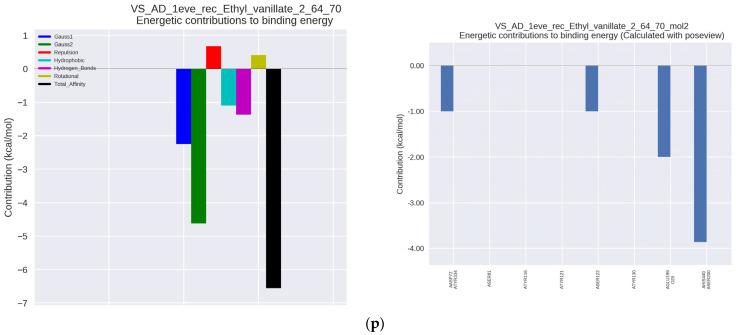
Figure 2.
At (a–p) results of docking simulation. On the top left: a 2D model of the ligand interaction (name in the graph) with AChE; from below: the energy values of the interactions that make up the total binding energy of the ligand with AChE; on the top right: energetic values of the AChE interactions to individual ligand atoms; from below: the total binding energy of the ligand to the most significant interacting AChE amino acid residues.

