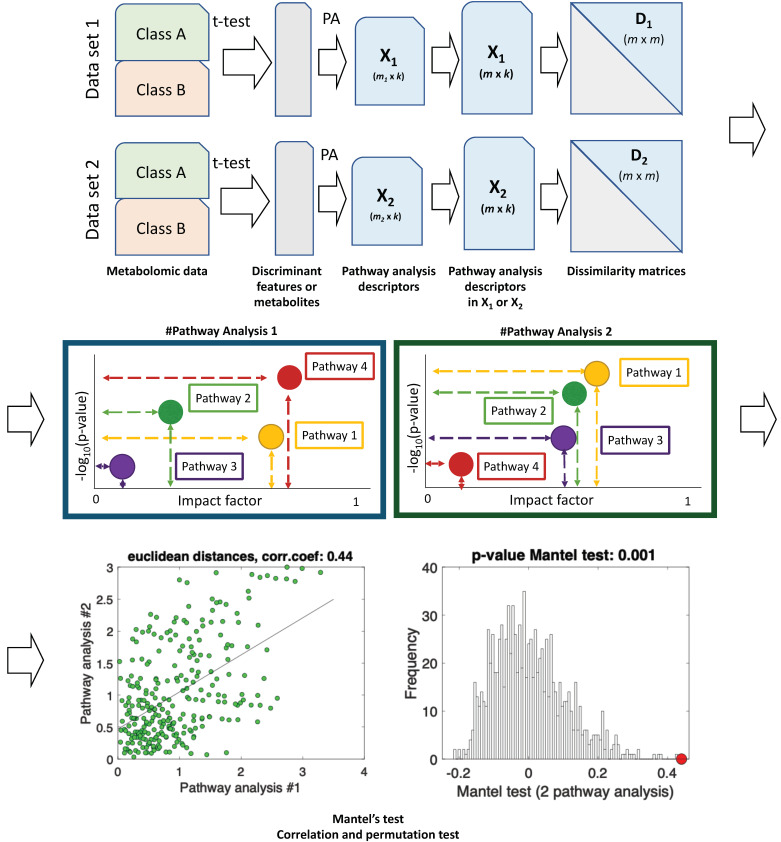
Figure 5.
Schematic workflow for the functional correlation analysis of results from metabolic pathway analysis. Metabolomics data between two groups is compared by t-test analyses in two different datasets. Discriminant features or metabolites are identified, and metabolic pathway analysis performed. Results from pathway analysis are summarized with 2 k descriptors (the log10 (p-value), and the enrichment or impact factor) as coordinates of two data matrices X1 (m1 × k) and X2 (m2 × k) (m = pathways). As the number and identity of the pathways included in the results may vary across studies, for those pathways present in a single analysis, the p-values and the enrichment or impact factors are imputed as 1, and 0, respectively, in the other one (X1(m × k), X2(m × k). For each matrix × (m × k), a distance or dissimilarity matrix is computed (i.e., D1(m × m) and D2(m × m)) using a selected measure such as the Euclidean or the standardized Euclidean distance. Then, the lower triangular part of each dissimilarity matrix is unfolded into two vectors (d1 and d2) to calculate the pairwise linear correlation coefficient, (e.g., Pearson coefficient, or the rank-based Spearman correlation coefficient if non-linearity is expected) between them. The statistical significance of the calculated correlation coefficient between pathway analysis #1 and #2 is estimated using a permutation test and the correlation coefficient is computed for each permutation. Original figure from [73].

