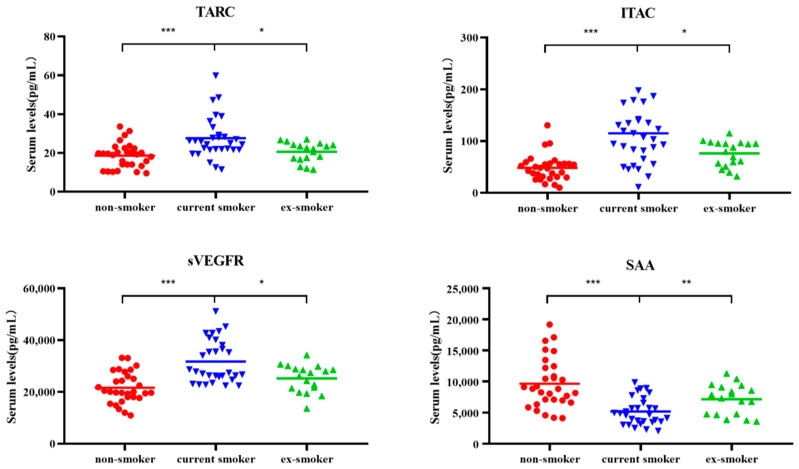
Figure 2.
Scatter plots of serum levels (pg/mL) of cytokines TARC, ITAC, sVEGFR3, and SAA for non-smokers (n = 30), current smokers (n = 30), and ex-smokers (n = 18). Whiskers calculated using the Tukey method. Outliers not shown. * p < 0.05, ** p < 0.01, *** p < 0.001: Kruskal–Wallis test and Dunn’s multiple comparison test.

