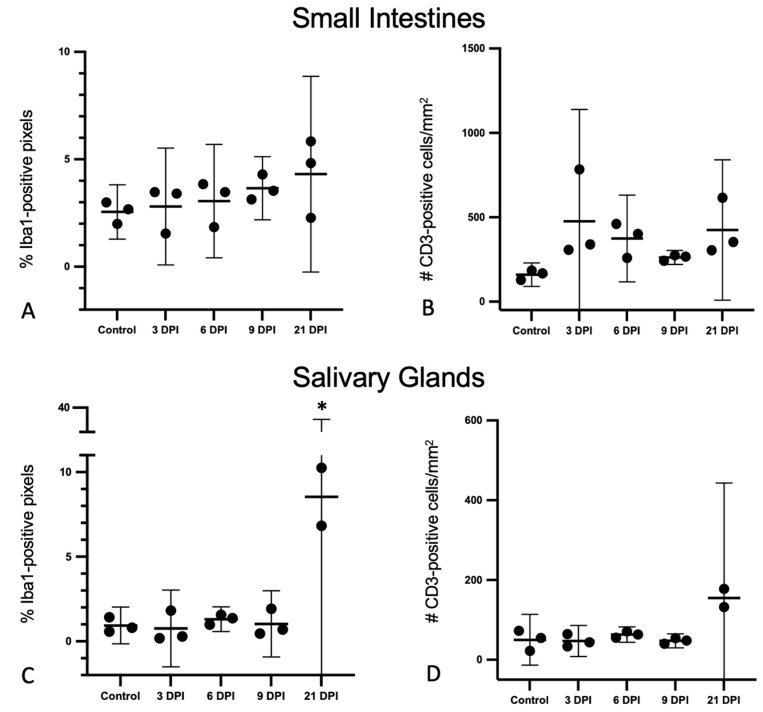
Figure 5.
Iba1+ pixel percentages and CD3+ cell counts obtained by immunohistochemistry and whole-slide digital image analyses of the small intestines and salivary glands from SOSV-infected Egyptian rousette bats. Individual groups are represented on the x axis and each dot represents the score for a single bat. Bars represent the mean and lines represent the ±95% confidence interval. Control bats were euthanized at 21 DPI. (A) Percentage of Iba1-immunopositive pixels in the small intestines. (B) Number of CD3-immunopositive cells in the small intestines per mm2 tissue. (C) Percentage of Iba1-immunopositive pixels in the small intestines. The Iba1% positive pixel count was significantly increased in the salivary glands of SOSV-infected bats at 21 DPI relative to the controls (*). (D) Number of CD3-immunopositive cells in the small intestines per mm2 tissue.

