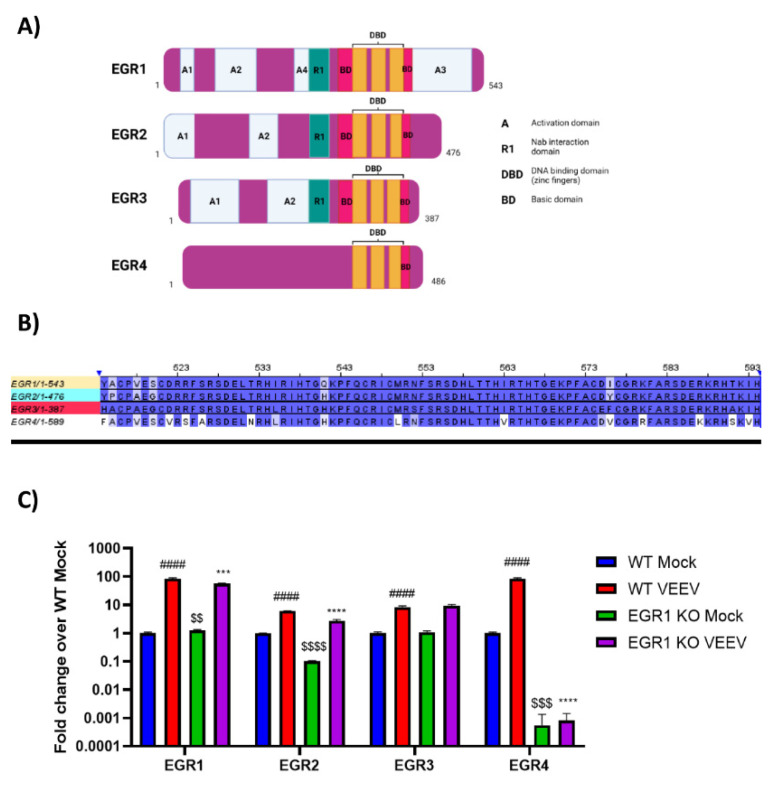
Figure 4.
EGR family members are at least partially regulated by EGR1. (A) Schematic of EGR family members gene regions. Figure adapted from [49]. (B) Alignment of EGR family member DNA binding domains. (C) Wildtype or EGR1−/− U87MG cells were infected with VEEV TrD at an MOI of 5 for 1 h. RNA was extracted from samples collected at 16 hpi. Gene expression was determined by RT-qPCR using TaqMan assays. Data were normalized to mock-infected cells and 18S RNA by the ∆∆CT method. #### p-Value ≤ 0.0001 (comparison between WT mock and WT VEEV), *** p-Value ≤ 0.001, **** p-Value ≤ 0.0001 (comparison between WT VEEV and EGR1−/− VEEV), $$ p-Value ≤ 0.01, $$$ p-Value ≤ 0.001, $$$$ p-Value ≤ 0.0001 (comparison between WT mock and EGR1−/− mock).

