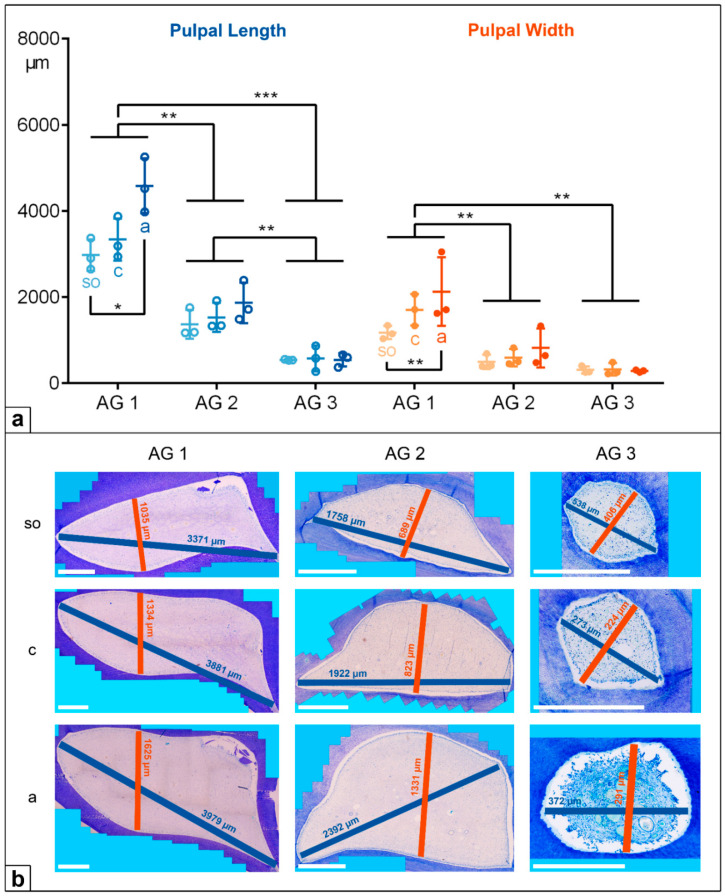
Figure 5.
(a) Dot-plot diagram showing the pulpal length (blue colours) and width (orange colours) of cheek teeth of different age groups (AG). Within each age group, the following horizontal levels are shown: so (subocclusal), c (central), and a (apical). Mean: central horizontal bar. Standard deviation: vertical whiskers. p-values are indicated as p ≤ 0.05 (*), p ≤ 0.01 (**), and p ≤ 0.001 (***). (b) Figures presenting the horizontal expansion of the dental pulp in incisors regarding different age groups (AG) and different horizontal levels (so, c, a). Scale bar: 500 µm.

