Figure 1.
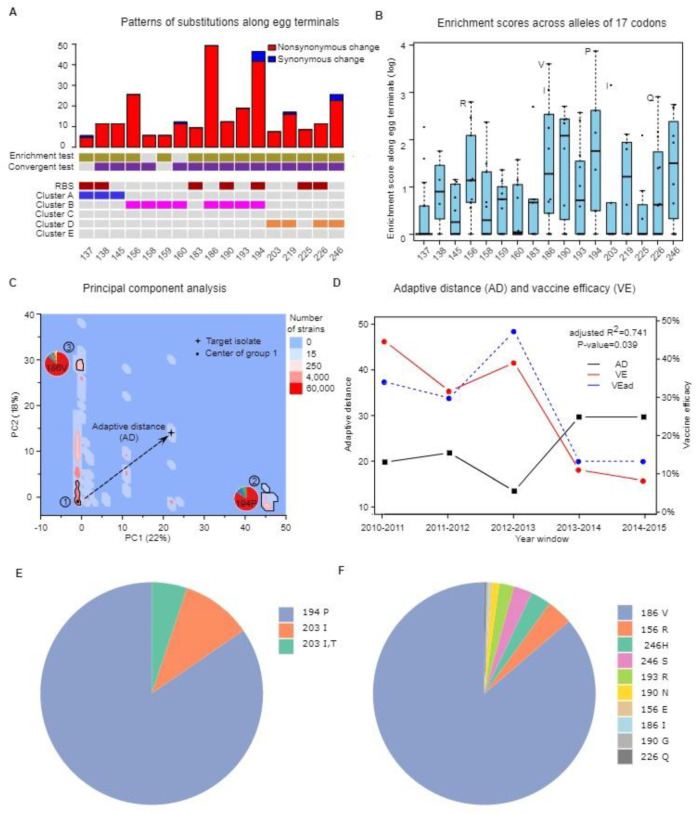
Statistical approaches for characterizing egg passage adaptation. (A) Numbers of nonsynonymous and synonymous changes at HA1 codons responsible for egg passage adaptation. The codons showing statistical significance from the enrichment and convergent tests (q-value < 0.05) are labelled in yellow and purple, respectively. Codons located in functional domains such as receptor binding sites (RBS), antigenic epitope A, B and D will be labeled in red, blue, violet and orange color respectively. (B) Enrichment scores across codons responsible for the egg passage adaptation. Alleles with enrichment scores higher than 20 are labeled. (C) Principal component analysis of the 17-dimensional space of ES scores for all the sequences. Discrete subgroups of sequences carrying different passage-related alleles distribute in clusters away from the major cluster. Pie charts display major adaptive alleles in different groups. For example, 194P and 186V are the dominant adaptive alleles observed in cluster 2 and 3, respectively. Adaptive distance (AD) is defined as the distance between the target strain (e.g., CVV) and the centroid of the major cluster for most of the non-egg sequences (i.e., group 1). (D) Correlation between the adaptive distance (AD) and vaccine efficacy (VE) between influenza seasons from 2010 to 2015. The predicted VEad is drawn as the dashed line. (E) Proportion of different alleles with enrichment score >10 in the cluster 2 of the PCA map (panel (C)). (F) Proportion of different alleles with enrichment score >10 in the cluster 3 of the PCA map (panel (C)).

