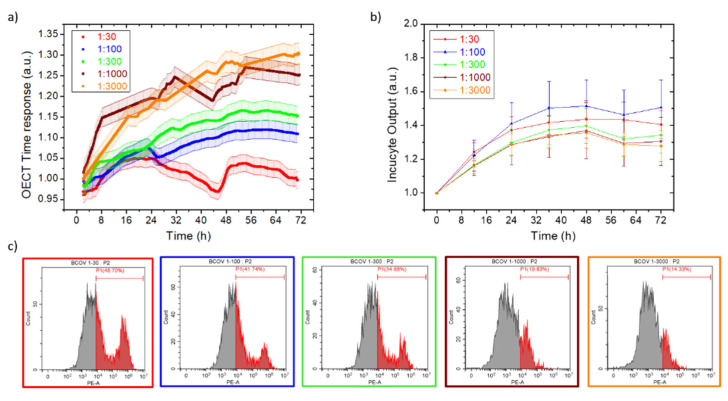
Figure 3.
OECT (a) and Incucyte® (b) real-time monitoring of HRT-18 cells, infected with progressively diluted B-CoV concentrations in suspension. Each OECT time response point is the average of five consecutive measurements, having the standard deviation reported as a curve shadow. (c) The cytofluorimeter analysis of the HRT-18 dead population after 72 h of B-CoV incubation, at increasing viral dilutions (from left to right).

