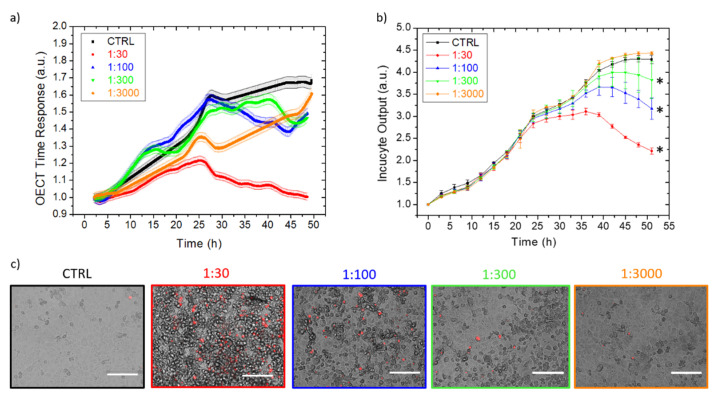
Figure 5.
The OECT (a) and Incucyte® (b) real-time monitoring of VERO E6 cells, infected with progressively diluted EMCV, compared to healthy cell growth, as the control. Each OECT time response point is the average of five consecutive measurements, having the standard deviation reported as the curve shadow. (c) The optical micrographs on the active area of the devices after 48 h of EMCV incubation at different dilutions and the control over a standard healthy growth, using a red staining dye for dead cells. * p < 0.05 denotes a significant difference compared to the control.

