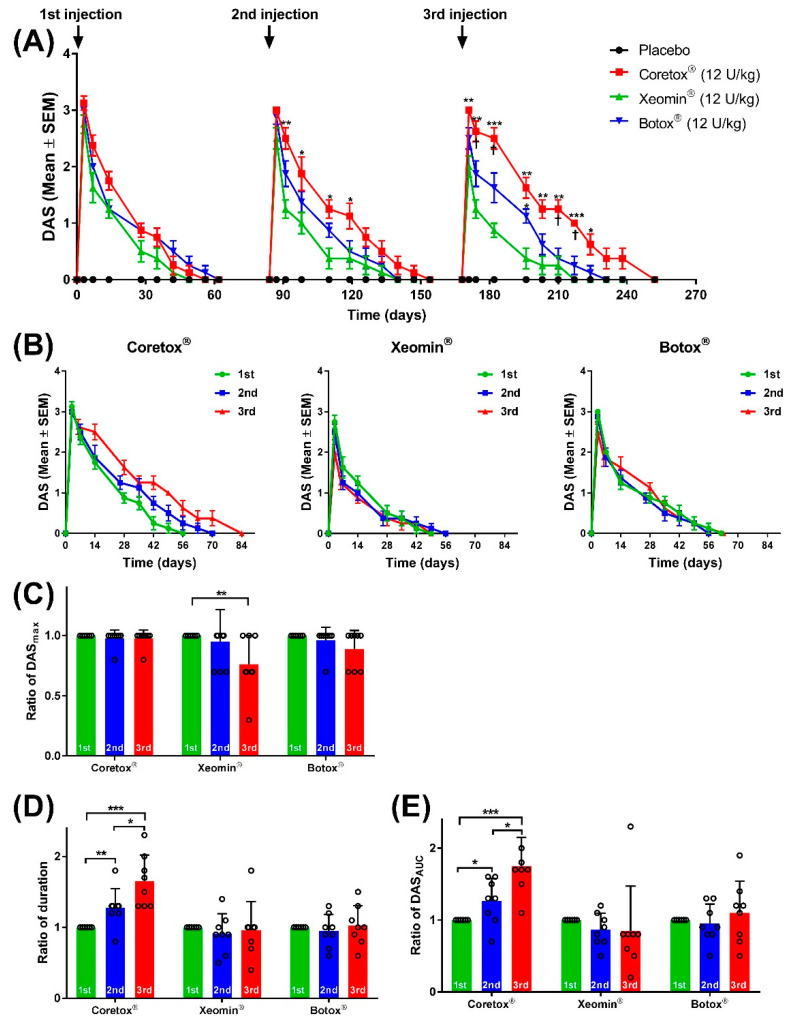
Figure 1.
(A) Time course of local paresis on the ipsilateral hind limb of mice based on digit abduction score (DAS) following repeated intramuscular (IM) injections of BoNT/A formulations administered to the right gastrocnemius. (B–E) Graphs showing changes in DAS values (B); ratio of DASmax (C), duration of action (D), and DASAUC (E) of the BoNT/A formulations after each repeated IM injection (12 weeks interval) relative to the first injection. Paretic effects are graded using a modified DAS criterion (0 to 4, increasing magnitude). (A,B) Data points represent mean DAS ± SEM at different time points (n = 8 per group on the first dosing cycle; n = 7~8 per group on the second dosing cycle; n = 6~8 per group on the third dosing cycle). (C–E) Dot plot represents individual values with columns and error bars representing mean ± standard deviation. (A) * p < 0.05, ** p < 0.01, *** p < 0.001 between Xeomin® and Coreotox® or Xeomin® and Botox®, and † p < 0.05 between Coretox® and Botox® by Mann–Whitney test. (C–E) * p < 0.05, ** p < 0.01, *** p < 0.001 between repeated doses by Student’s t-test. BoNT/A, botulinum neurotoxin type A.

