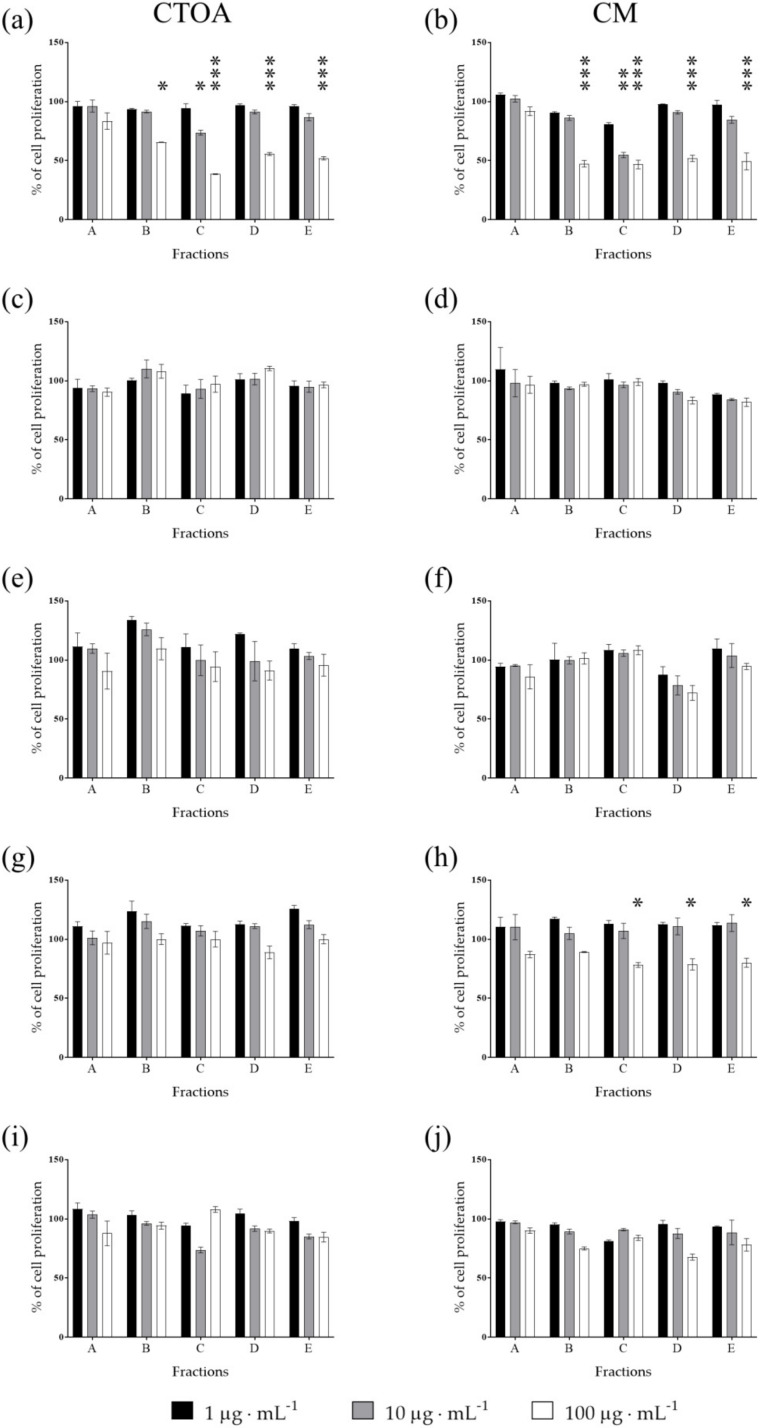
Figure 4.
Antiproliferative assay. Fractions obtained from raw extracts of CTOA and CM were tested at increasing concentration (1, 10 and 100 μg·mL−1) on A2058 (a,b), A549 (c,d), HepG2 (e,f), HaCaT (g,h) and MRC5 (i,j) cell lines. Cell proliferation was normalized using a control sample, containing only DMSO. Results are expressed as percent of cell proliferation after 72 h exposure (n = 3; * for p < 0.05; ** for p < 0.01; ***p < 0.001).

