Figure 5.
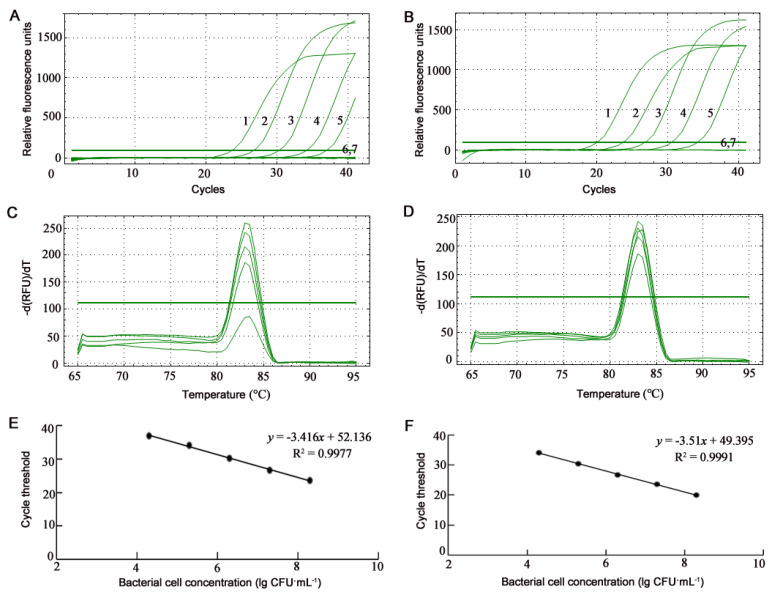
Profiles of SYBR Green real-time quantitative PCR (qPCR) assays on bacterial suspensions of Burkholderia glumae strain Os48 (A,C,E) and B. gladioli strain Os50 (B,D,F). (A,B) Amplification curves of SYBR Green qPCR assays. Numbers 1, 2, 3, 4, 5, and 6 indicate the 1-μL templates from bacterial suspensions at the concentration of 2 × 10⁸, 2 × 10⁷, 2 × 10⁶, 2 × 10⁵, 2 × 10⁴, and 2 × 10³ CFU·mL−1, respectively; 7 is ultrapure water without template. (C,D) Melting curves of SYBR Green qPCR assays show the single specific peak at Tm of 83 °C. (E,F) Standard curves of SYBR Green qPCR assays show a linear response between bacterial cell concentration (lg CFU·mL−1) and cycle threshold.

