Figure 6.
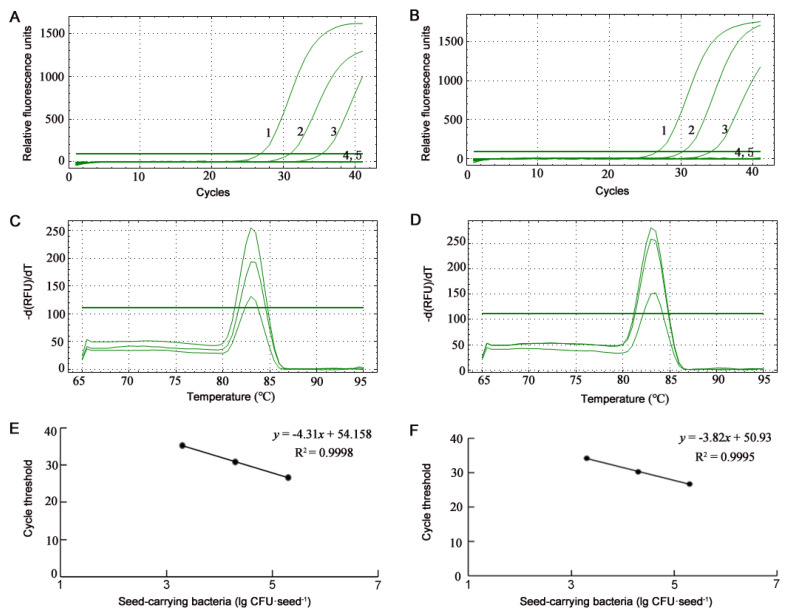
Profiles of SYBR Green real-time quantitative PCR (qPCR) assays on seed-carrying bacterial strains Burkholderia glumae Os48 (A,C,E) and B. gladioli Os50 (B,D,F). (A,B) Amplification curves of SYBR Green qPCR assays. Numbers 1, 2, 3, and 4 indicate the 1-μL templates from seed-carrying bacteria at the concentration of 2 × 10⁵, 2 × 10⁴, 2 × 10³, and 2 × 10² CFU·seed−1, respectively; 5 is the template from ultrapure water-treated seeds. (C,D) Melting curves of SYBR Green qPCR assays show the single specific peak at Tm of 83 °C. (E,F) Standard curves of SYBR Green qPCR assays show a linear response between bacterial cell concentration (lg CFU·seed−1) and cycle threshold.

