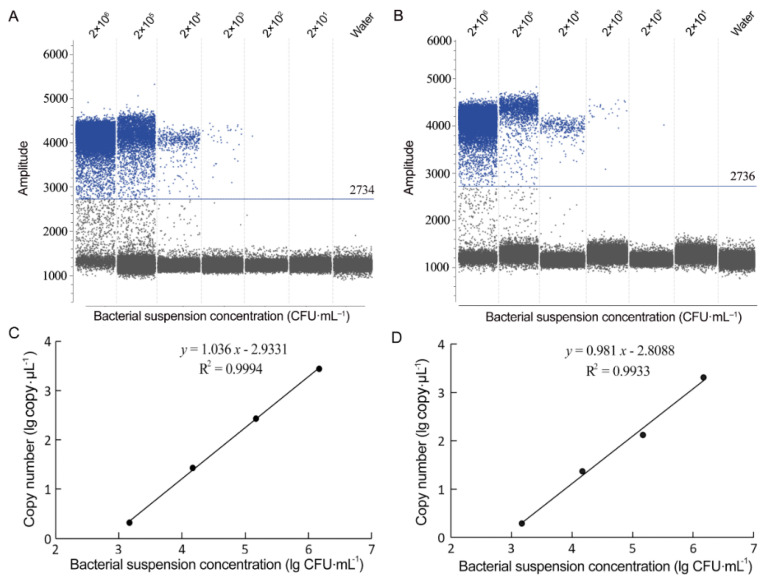
Figure 7.
Profiles of EvaGreen droplet digital PCR (dPCR) assays on bacterial suspensions of Burkholderia glumae strain Os48 (A,C) and B. gladioli strain Os50 (B,D). (A,B) Fluorescence amplitude 1-D plot of EvaGreen droplet dPCR assays on bacterial suspensions at the 10-fold diluted concentrations from 2 × 10⁶ to 2 × 10 CFU·mL−1; ultrapure water was used as the no template control. Blue line shows the threshold separating negative droplets from positive droplets; blue dots indicate positive droplets of amplification; grey dots indicate negative droplets of no amplification. One positive droplet (<2) detected at the concentration of 2 × 10² CFU·mL−1 was not considered as positive. (C,D) Regression curves of EvaGreen droplet dPCR show a linear response between bacterial cell concentration (lg CFU·mL−1) and copy number of detected target DNA.

