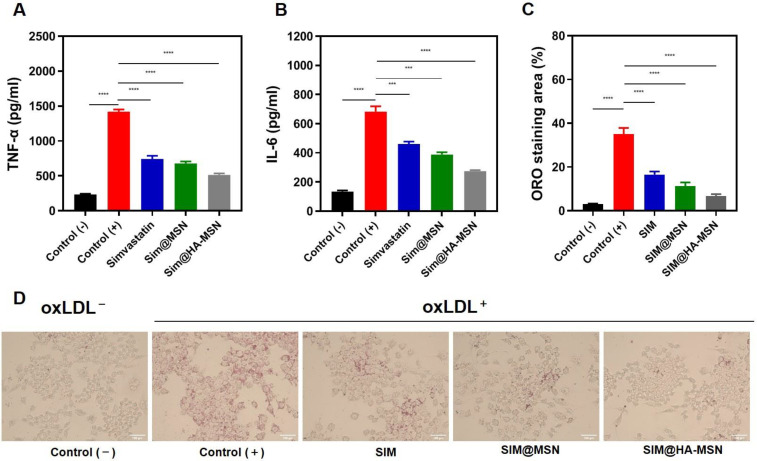
Figure 6.
Quantification of proinflammatory cytokines (A) TNF-α and (B) IL-6 secreted by Raw264.7 cells after different treatments at equivalent SIM concentrations for 24 h (n = 3). (C) Quantification of oil red O staining areas and (D) oil red O staining optical microscopy images of Ox-LDL-induced foam cell formation after various treatments at equivalent SIM concentrations for 24 h (n = 3). Variance among groups was determined by one-way ANOVA with Tukey post-hoc test (*** p < 0.001, **** p < 0.0001).

