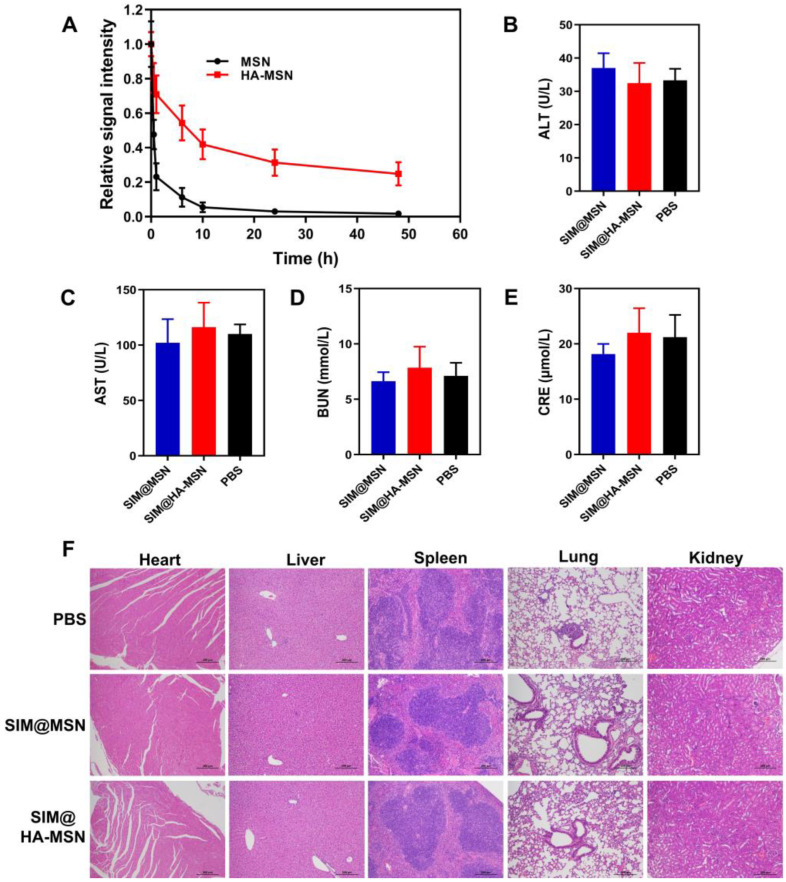
Figure 7.
(A) Relative fluorescence intensity of FITC-labeled MSN and HA-MSN in blood over 48 h (n = 6). (B–E) Serological biochemistry results of mice treated with SIM@MSN and SIM@HA-MSN at equivalent SIM concentrations for 4 weeks (n = 6). (F) Representative images of H&E-stained sections of major organs from mice after different treatments for 4 weeks (scale bar = 100 µm).

