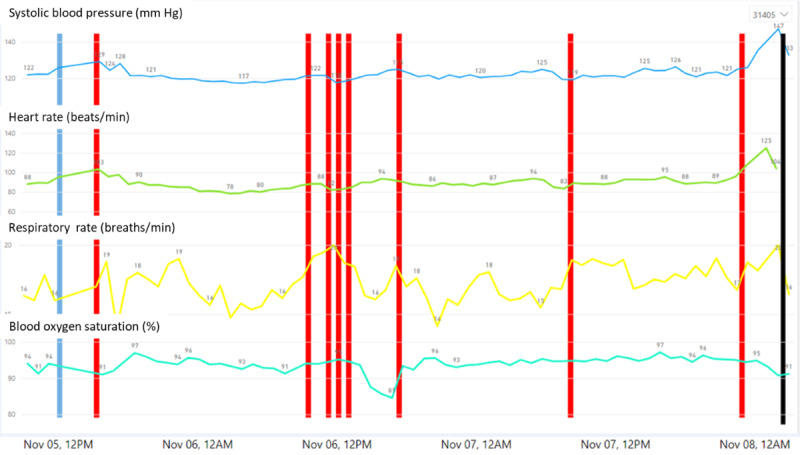
Figure 1.

Trends of continuous data gathered by the monitoring platform. Sample of the monitoring data from a single patient, showing systolic blood pressure (mm Hg), heart rate (beats/min), respiratory rate (breaths/min), blood oxygen saturation (%), and markings of warnings and prediction. The black line indicates the time of actual clinical detection of deterioration by the medical staff. Red lines indicate times at which high-risk warnings were provided by the platform using the National Early Warning Score.
