Figure 1.
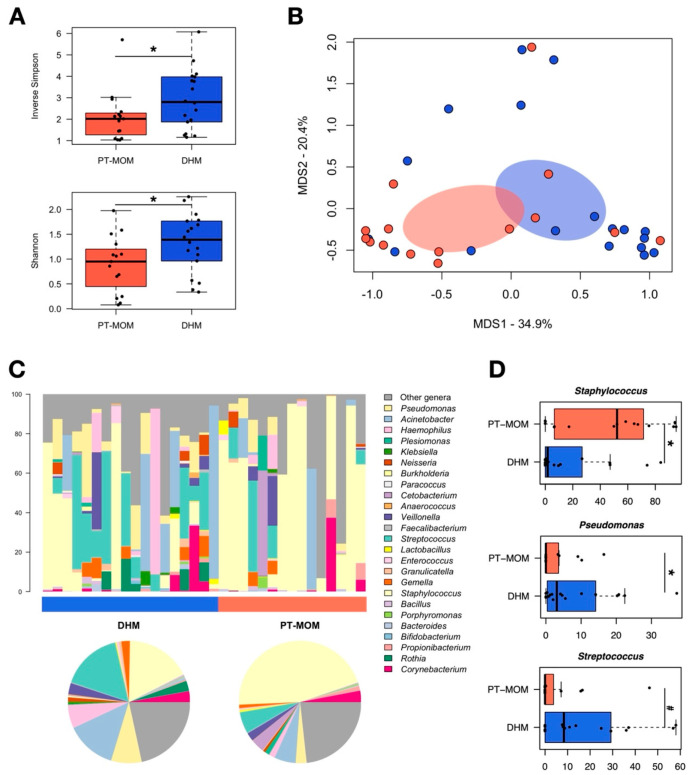
Milk microbiota from preterm-delivering mothers compared with donor human milk microbiota. (A) Boxplots showing the distribution of alpha diversity, assessed by the inverse Simpson (top) and Shannon (bottom) indices, in the milk microbiota from preterm-delivering mothers (PT-MOM) and donor human milk microbiota (DHM). *, p value ≤ 0.05, Wilcoxon test. (B) Principal coordinate analysis (PCoA) of the Bray-Curtis distances between the genus-level microbial profiles of the two study groups, PT-MOM (salmon) and DHM (blue). A significant separation was found (p = 0.02, permutation test with pseudo-F ratio). (C) Genus-level relative abundance profiles of PT-MOM and DHM samples. Data are shown in the bar charts for each sample and in the pie charts as mean values in the study groups. (D) Boxplots showing the relative abundance distribution of bacterial genera significantly differentially represented between groups. *, p ≤ 0.05, Wilcoxon test. For Streptococcus, only a trend was found (#, p = 0.08).

