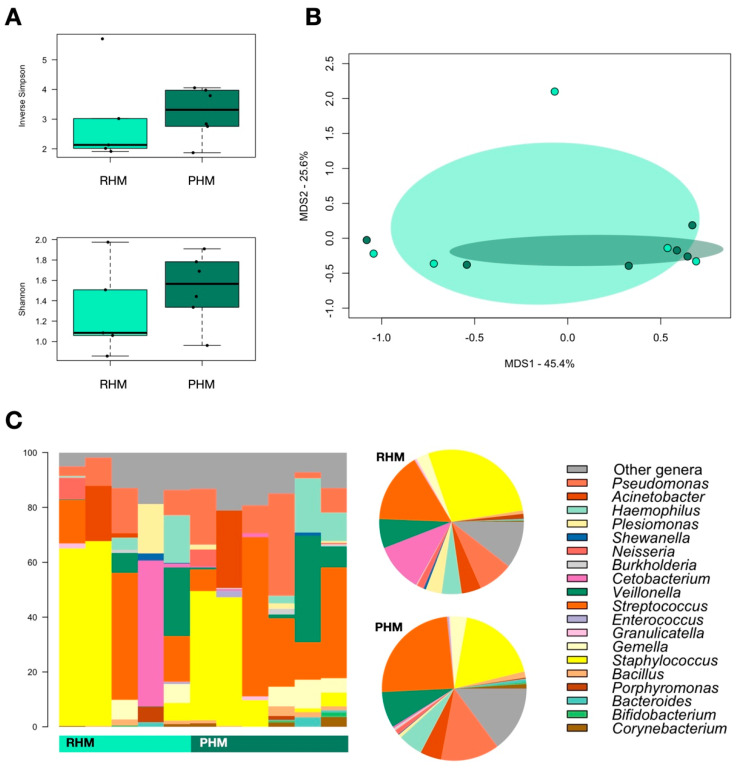
Figure 2.
The impacts of pasteurization on donor human milk microbiota. (A) Boxplots showing the distribution of alpha diversity, assessed by the inverse Simpson (top) and Shannon (bottom) indices, in donor human milk microbiota before (RHM) and after pasteurization (PHM). (B) Principal coordinate analysis (PCoA) of the Bray-Curtis distances between the genus-level microbial profiles of the two study groups, RHM (light green) and PHM (green). (C) Genus-level relative abundance profiles of RHM and PHM samples. Data are shown in the bar charts for each sample and in pie charts as mean values in the study groups.

