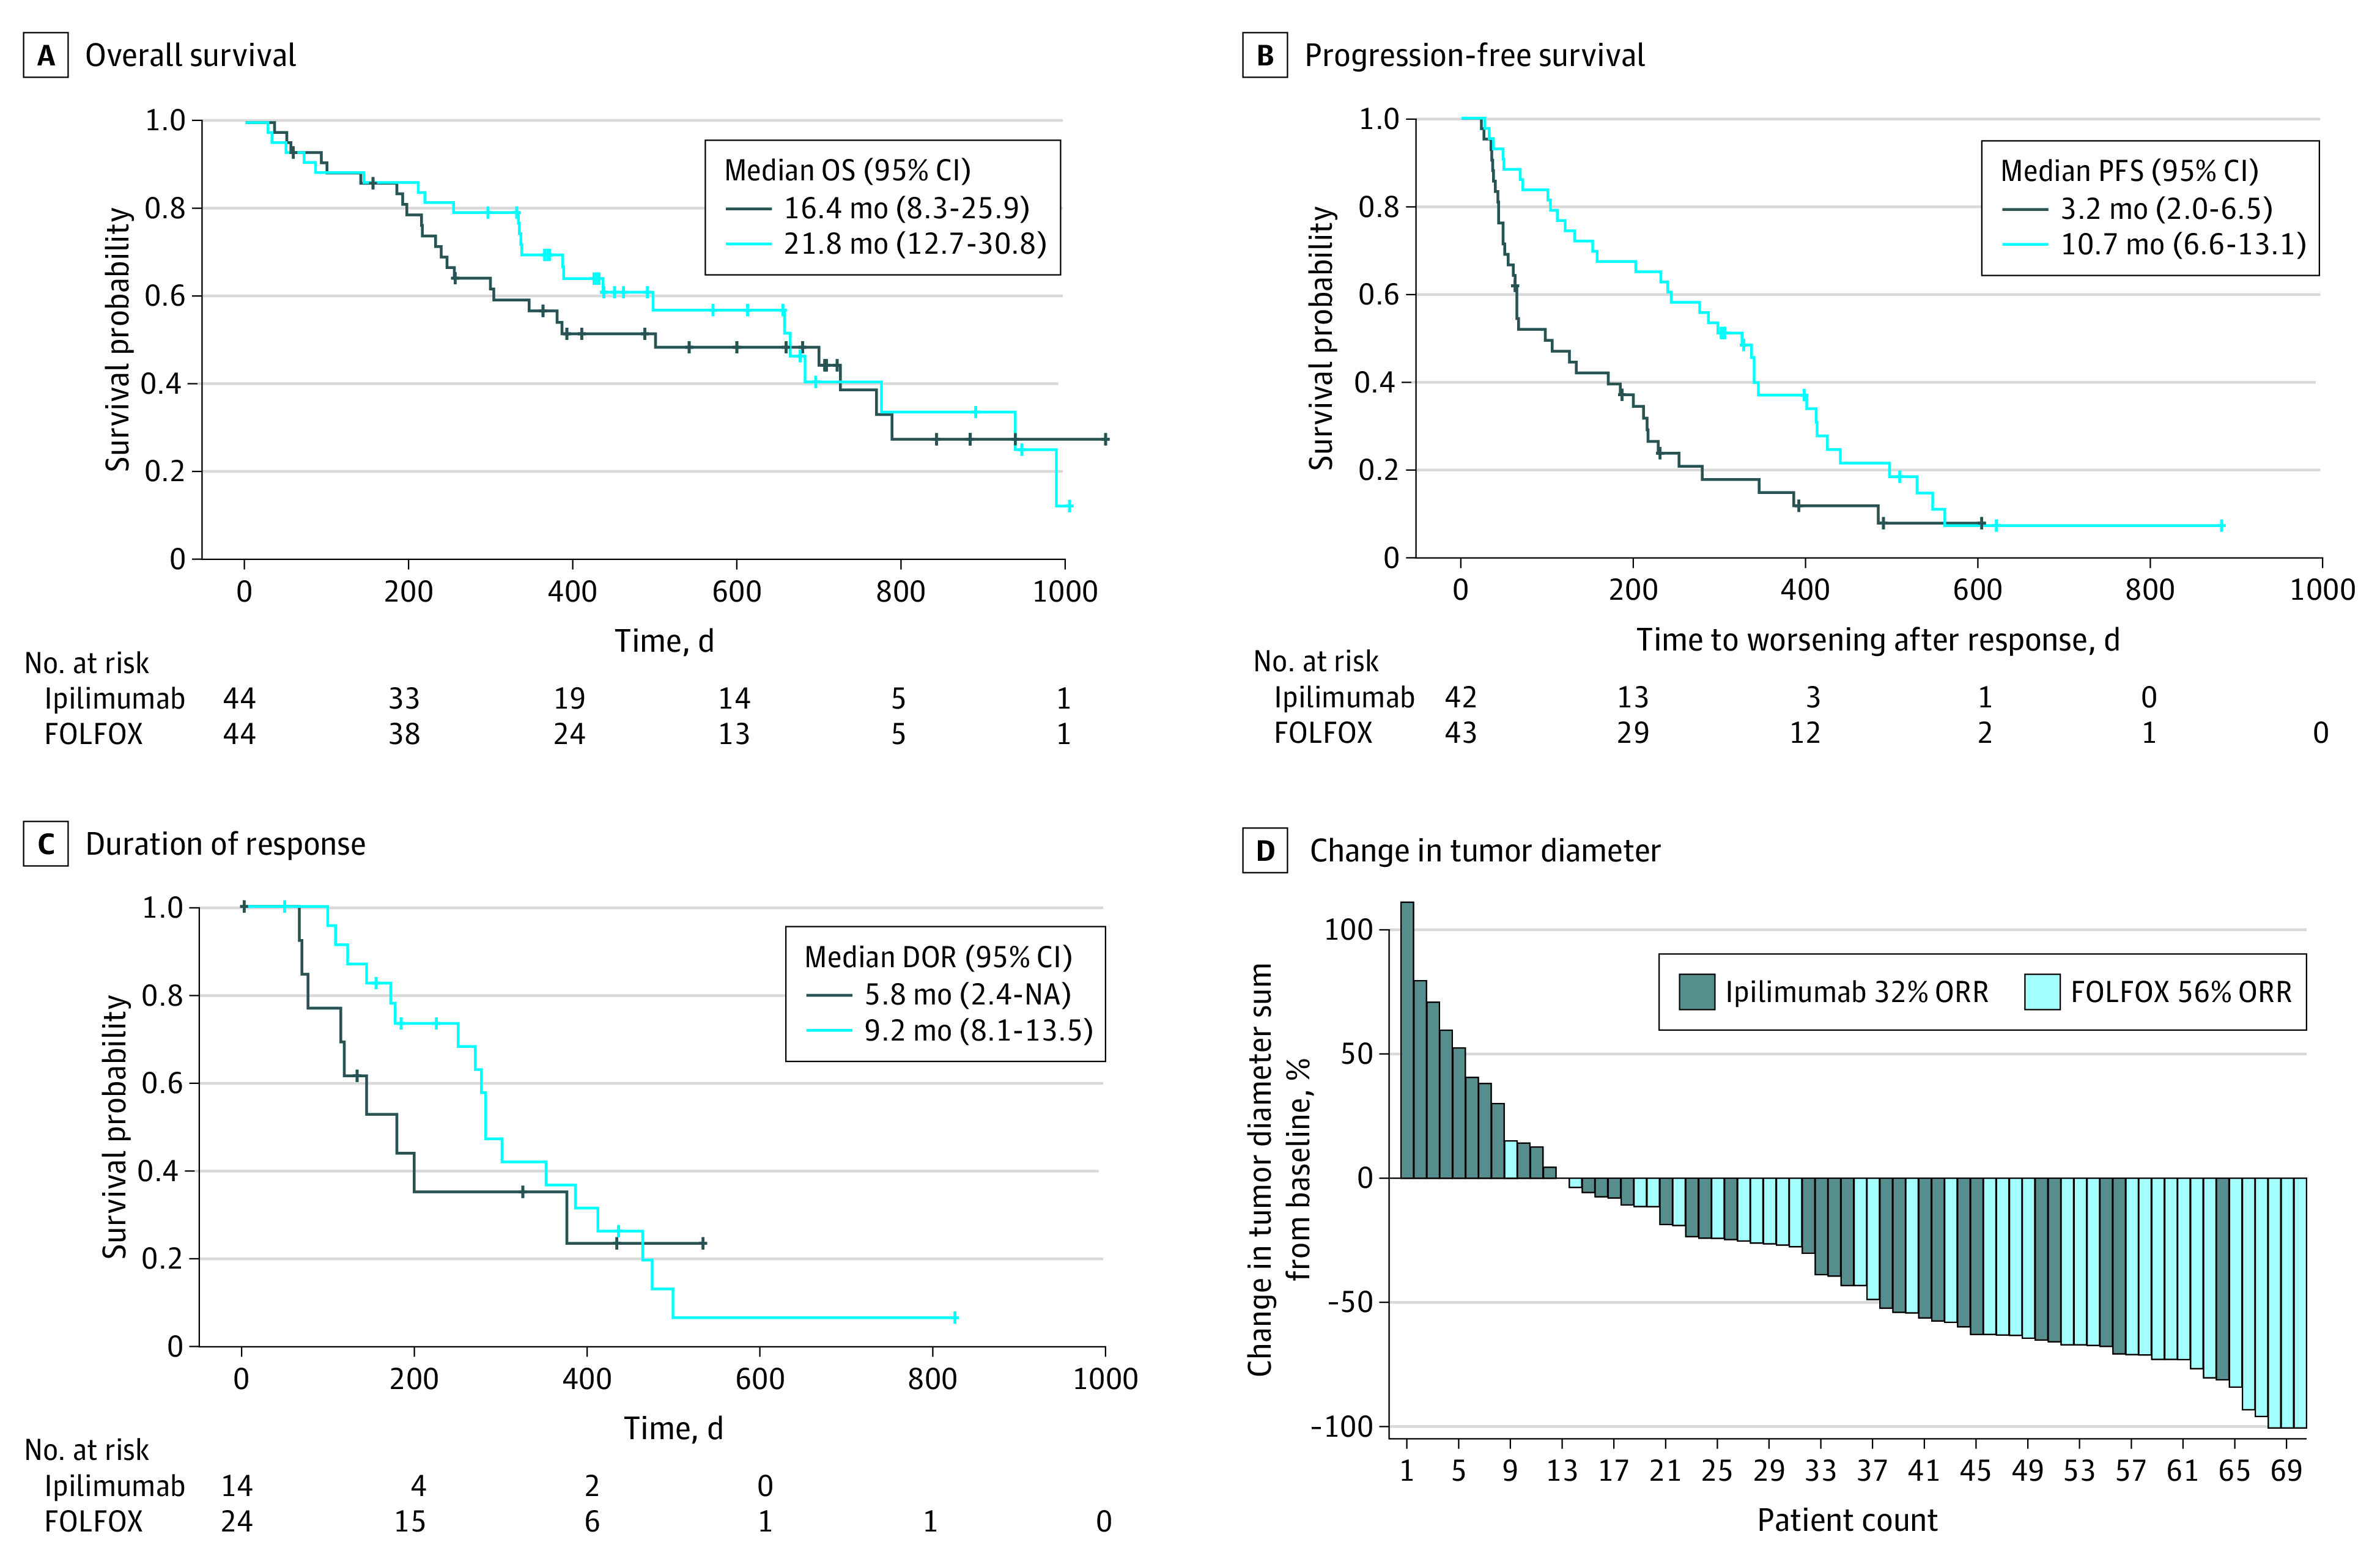
Figure 2. Clinical Outcomes of Patients Treated in the INTEGA Trial.

Overall (OS) (A) and progression-free survival (PFS) (B) are presented for the ipilimumab vs the FOLFOX arm. Duration of response (DOR) is shown in panel C. The waterfall plot (D) shows responses in individual patients in the intent-to-treat population (2 patients—1 in each arm—were allowed to continue in the trial based on clinical response and local treatment applied beside Response Evaluation Criteria in Solid Tumors progression). The key in panel D reports the ORRs. NA indicates not applicable; ORR, overall response rate.
