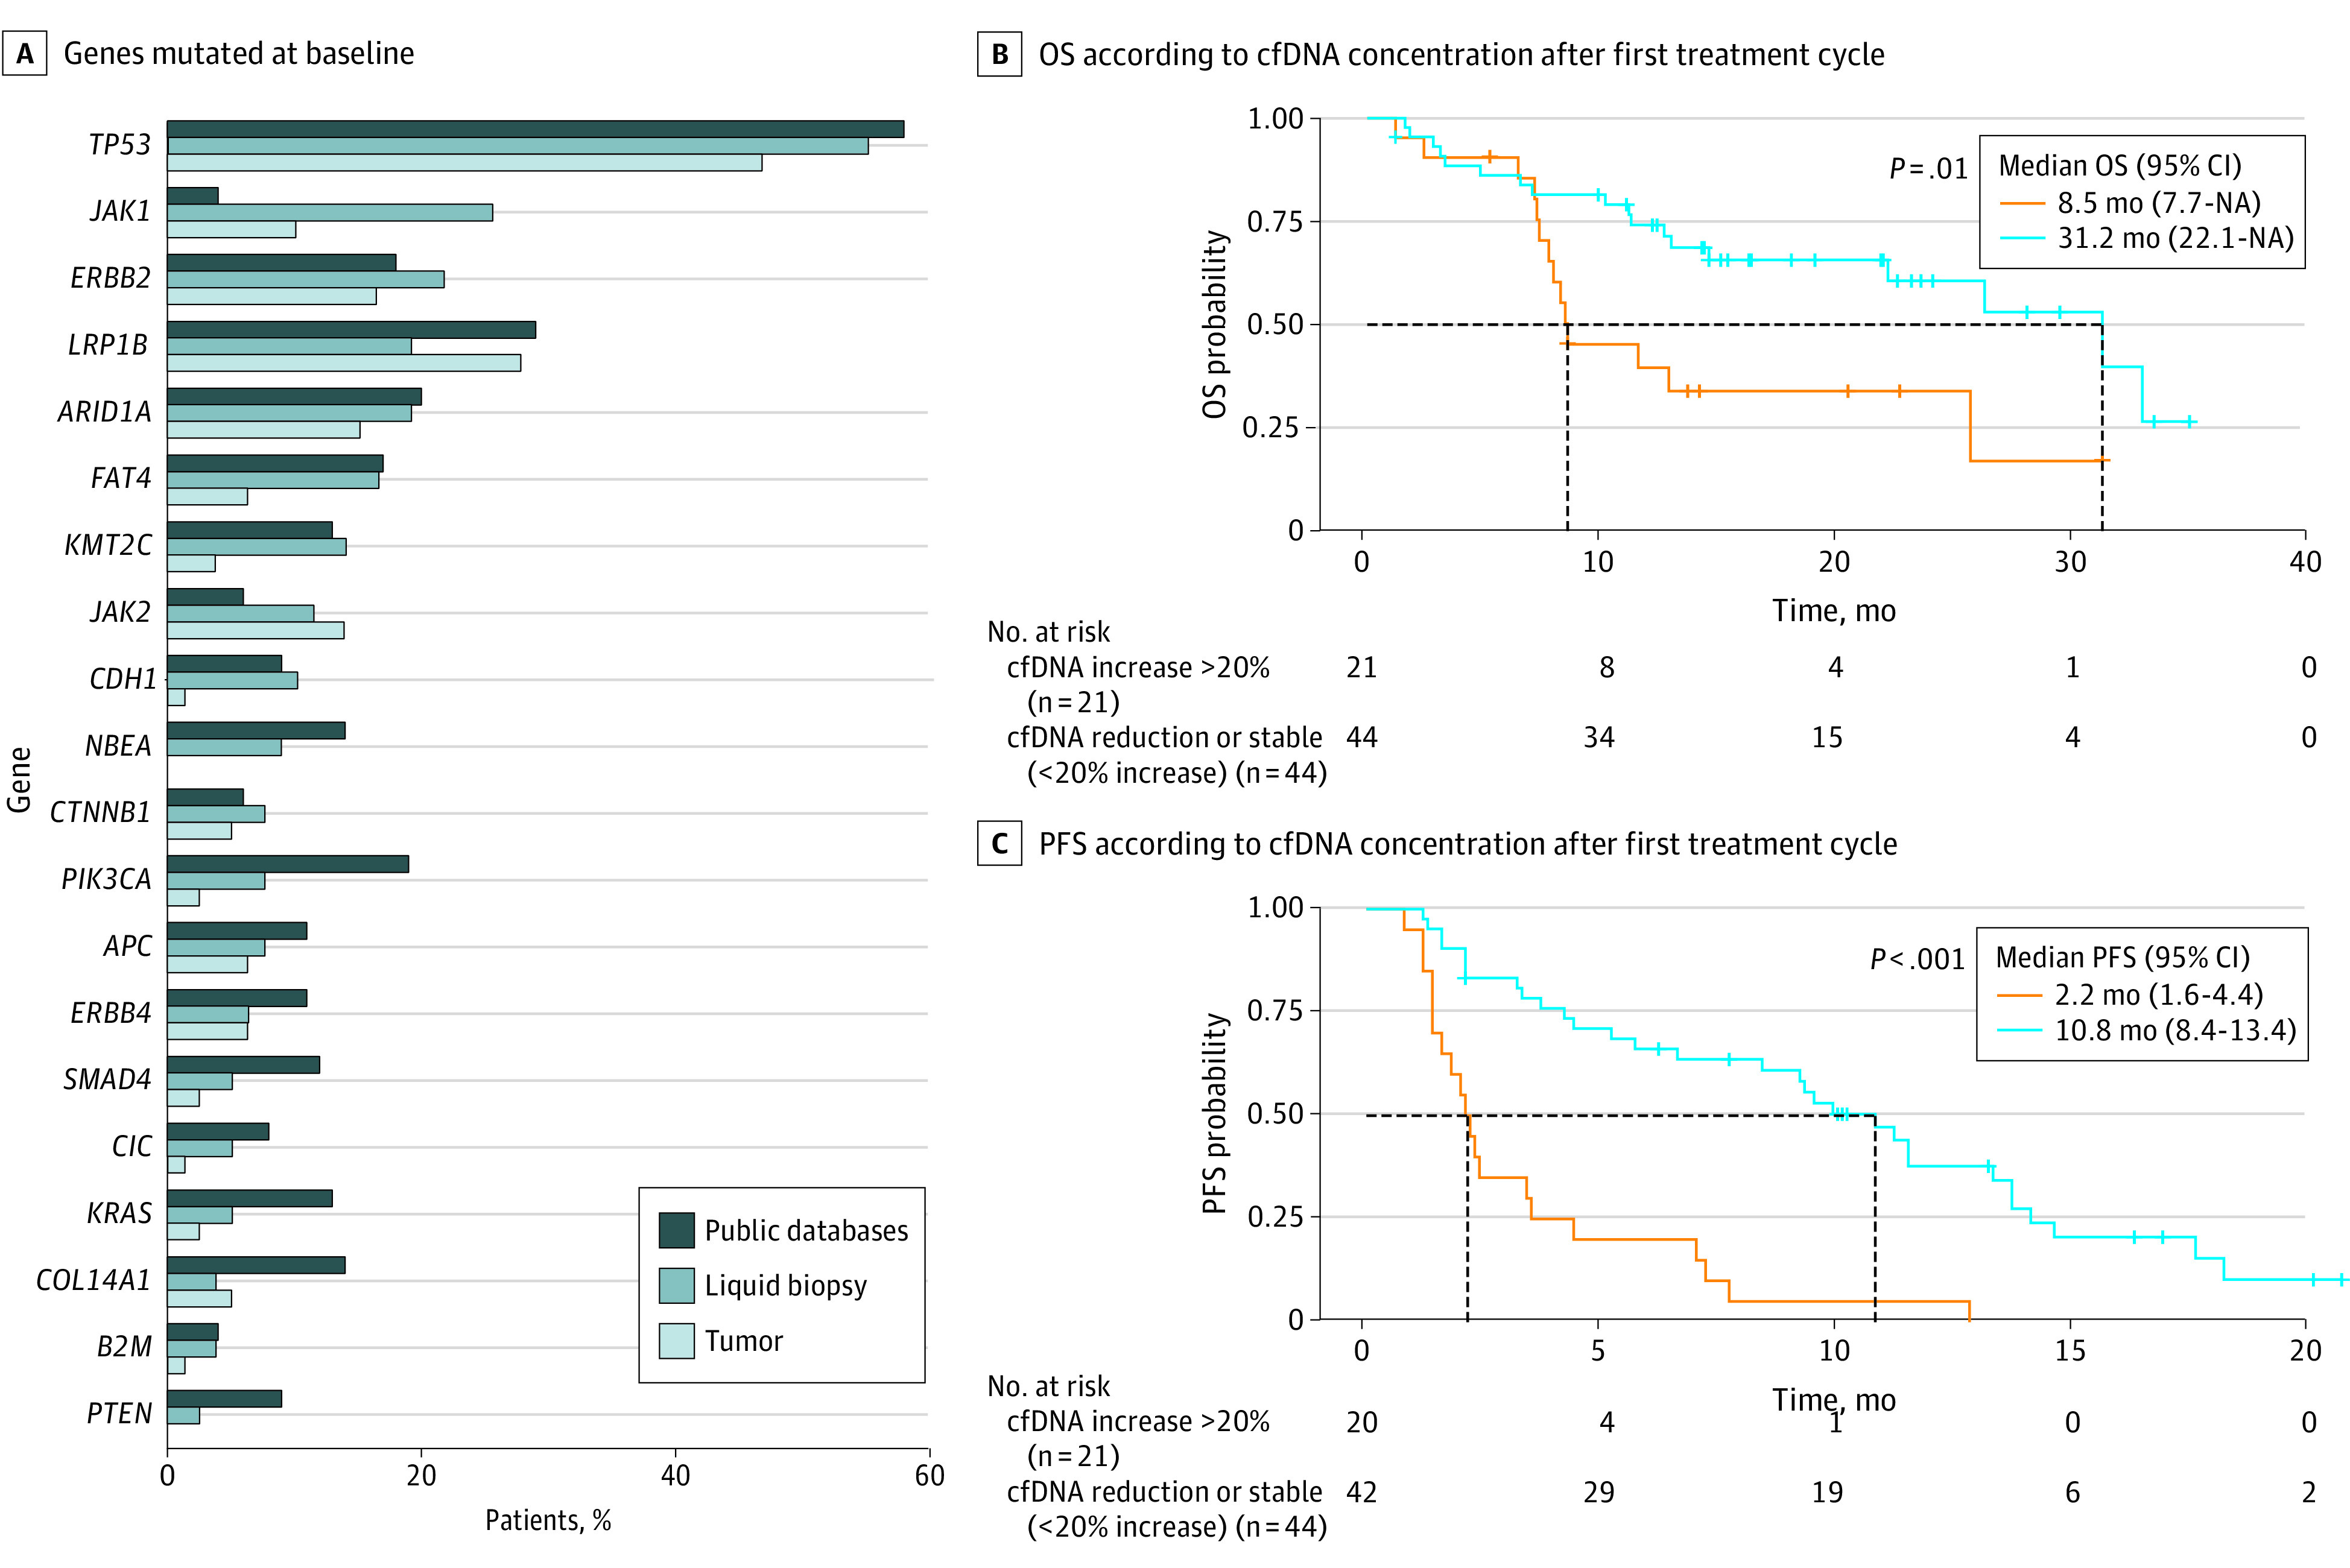
Figure 3. Mutational Profiling and Liquid Biopsy Disease Monitoring.

A, Percentage of patients with genes with sequence variations at baseline in liquid biopsy circulating cell-free DNA (cfDNA) and in tumor tissue. Published data of the mutational landscape of driver genes in esophageal and gastric cancer were obtained from database cBioPortal.16,17 B and C, Overall survival (OS) and progression-free survival (PFS) of patients according to the level of cfDNA in blood after the first treatment cycle (2-3 weeks) vs baseline levels. Patients with increase in cfDNA concentration of greater than 20% (n = 21) were plotted vs patients showing cfDNA reduction or stability (n = 44). P values were calculated using log-rank test. Median survival is illustrated in months (vertical dashed lines); the horizontal dashed lines indicate the median of both curves. NA indicates not applicable.
