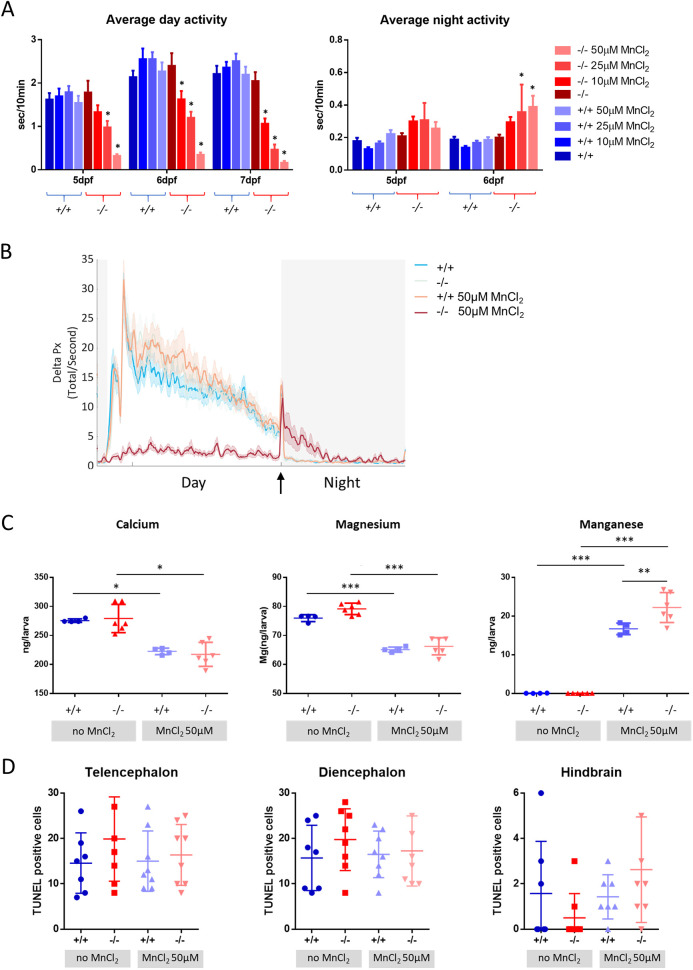
Fig. 5.
MnCl2 treatment causes locomotor abnormalities and Ca2+ dyshomeostasis. (A) Average locomotor activity of wild-type (blue) and slc39a14−/− larvae (red) during the day and night in response to increasing concentrations of MnCl2. Data are presented as mean±s.e.m. (two-way ANOVA with Tukey's posthoc test; *P<0.05), n=24 larvae per group. The y-axes represent the average activity of larval zebrafish in seconds per 10 minutes. (B) Frame-by-frame analysis of the locomotor activity of wild-type and slc39a14−/− larvae at 6 dpf that were unexposed and exposed to 50 µM MnCl2. White shading representing the day (lights ON) and grey shading represents the night (lights OFF). The arrow indicates the ‘lights OFF’ switch. Summed and smoothed Δ pixels traces (Delta Px) are shown as mean±s.e.m. (bold lines and shaded surrounding areas). n=24 larvae per group. (C) Calcium, magnesium and manganese concentrations determined by ICP-MS in untreated and MnCl2 (50 µM)-treated wild-type and slc39a14−/− larvae. Data are presented as mean±s.d. (one-way ANOVA with Tukey's post hoc test; *P<0.05; **P<0.01; ***P<0.001). (D) Apoptotic cell death upon MnCl2 exposure in both wild-type (blue) and mutant (red) larvae at 5 dpf detected by TUNEL staining in the telencephalon, diencephalon and hindbrain. Data are presented as mean±s.d.

