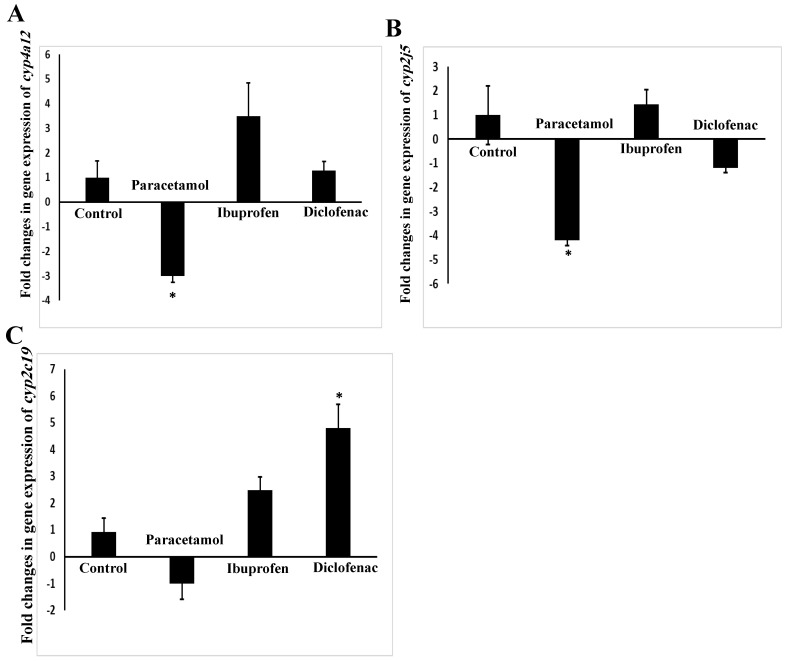
Figure 7.
Expressions of cyp4a12 (A), cyp2j5 (B), and cyp2c29 (C) genes in the lungs of NSAID- and paracetamol-treated mice. The target expression was quantified relative to the expression of the actin gene. Fold change is the ratio of mean expression of the NSAID- and paracetamol-treated to the control value; negative values indicate a reduction in fold change; * indicates a statistical difference (p < 0.05, one-way ANOVA test) in comparison with the control group.

