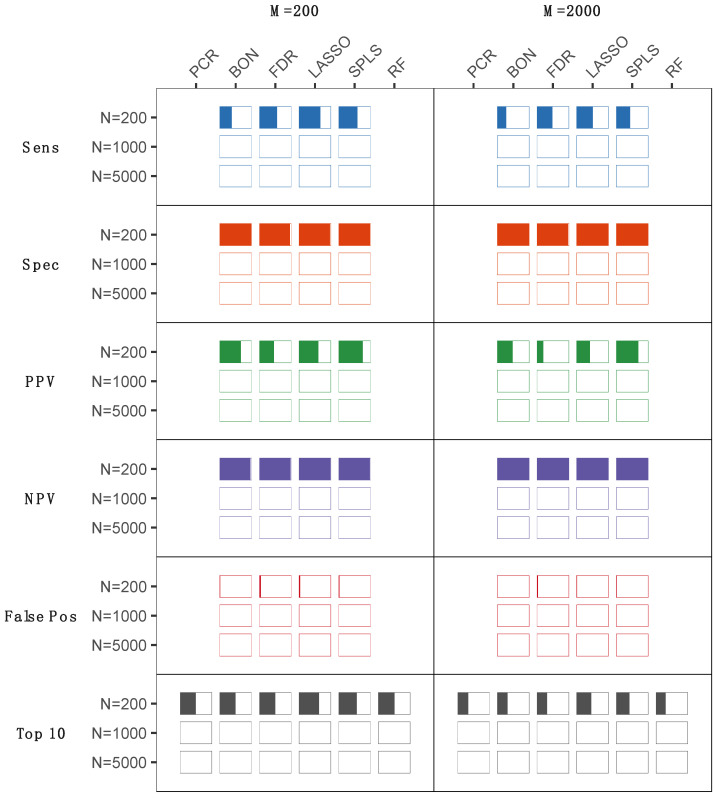
Figure 1.
Results for a continuous outcome. The sensitivity, specificity, positive predictive value (PPV), negative predictive value (NPV), and false positive rate are displayed (as percent color fill of each bar) for each statistical method, reflecting their ability to correctly identify the top ten simulated metabolite associations across varying numbers of total metabolite measures (M = 200 or M = 2000) in study samples collected from varying numbers of study subjects (N = 200, N = 1000, or N = 5000). PCR, principal components regression; BON, Bonferroni; FDR, false discovery rate; LASSO, least absolute shrinkage and selection operator; SPLS, sparse partial least squares; RF, random forest.

