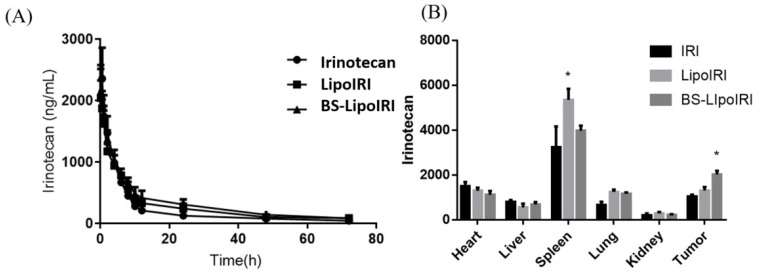
Figure 6.
(A) Plasma concentration-time curves of irinotecan after intravenous administration of IRI, LipoIRI, and BS−LipoIRI at a dose of 20 mg/kg in rats. (B) Tissue distributions of irinotecan at 16 h after intravenous administration of IRI, LipoIRI, and BS−LipoIRI at a dose of 20 mg/kg into BxPC3 tumor-bearing SCID mice. * p < 0.01, a statistically significant difference compared with the IRI group.

