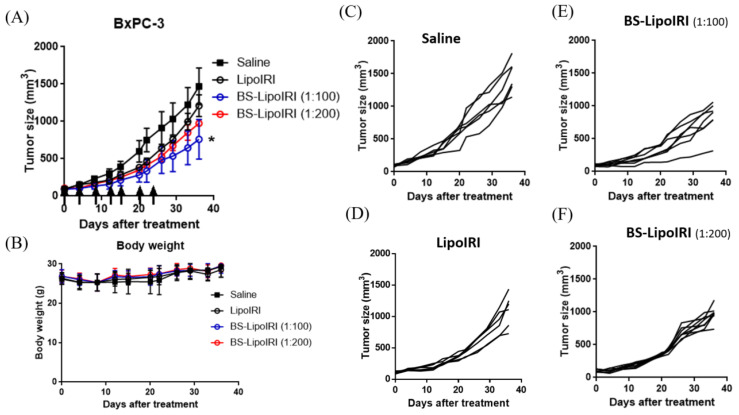
Figure 7.
(A) The BxPC3 tumor growth curve after intravenous administration at a dosing regimen of 20 mg/kg IRI. (B) Body weight changes in tumor-bearing mice. Tumor size of individual mouse in the (C) Saline, (D) LipoIRI, (E) BS−LipoIRI (1:100), and (F) BS−LipoIRI (1:200) group. * p < 0.01, a statistically significant difference compared with the saline group.

