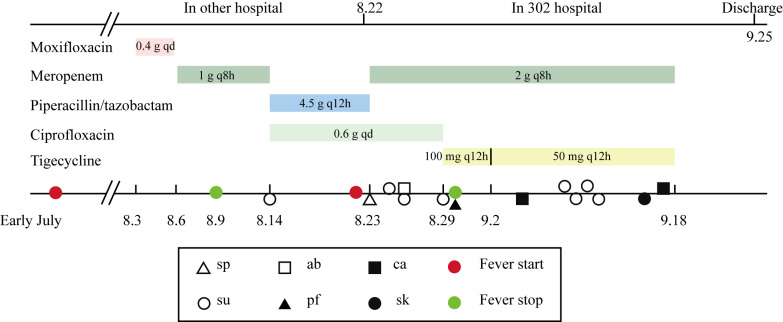
Figure 2.
Timeline of antibiotic usage and K. pneumoniae isolation. Rectangles of various colors represent the time of antibiotic usage. Triangles, squares, and circles represent the time of K. pneumoniae isolation from different specimens. The red circle represents the time of fever initiation, and the green circle represents the time of fever cessation. sp: sputum, ab: abdominal fluid, su: shunt fluid, pf: pleural fluid, ca: catheter, sk: skin.

