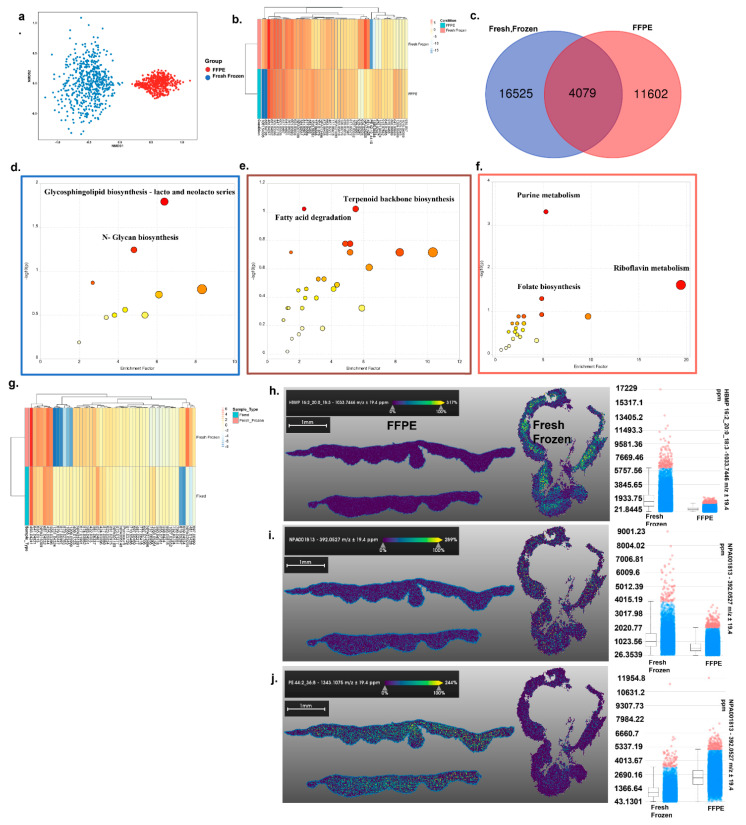
Figure 2.
MALDI negative mode imaging of skin tissue: (a) Nonmetric dimensional plot of the metabolites present in fresh frozen and FFPE samples. Significant p-values from ANOSIM test showed there are differences in the metabolic profiles of the group tested (Stress: 0.03219174, ANOSIM statistic R: 1, significance: 1 × 10⁻⁴). (b) The heatmap plot of the top 50 most significantly different metabolites between the two groups. (c) Venn diagram showing the unique and shared putative metabolites between the two comparisons. (d–f) Metabolic pathway analysis plot created using MetaboAnalyst 5.0. Plots depict several metabolic pathway alterations when unique and shared metabolites from the fresh frozen and FFPE samples were tested. (d) Differential metabolites calculated from FFPE vs. fresh frozen. (e) Common metabolites from the Venn diagram were sorted based on p-value (high to low). (f) Differential metabolites calculated from fresh frozen vs. FFPE. (Pathway graph color box corresponds to the same color in Venn diagram). The y-axis is the –log10 of the p-value; pathways that were most significantly changed are characterized by high –log10(p) values (top middle or right region). (g) The top 50 common metabolites were sorted based on p-value and represented as a heatmap. (h–j) Specific metabolite distribution images are presented along with an intensity box plot. (h) HBMP 16:2_20:0_18:3 distribution in both tissues and an intensity box plot of the same metabolite’s distribution. (i) NPA001813 distribution in both tissues and an intensity box plot of the same metabolite’s distribution. (j) PE 44:2_36:8 distribution in both tissues and an intensity box plot of the same metabolite’s distribution.

