
Figure 4. EuCeO2NPs facilitate Aβ uptake in BV2 cells.
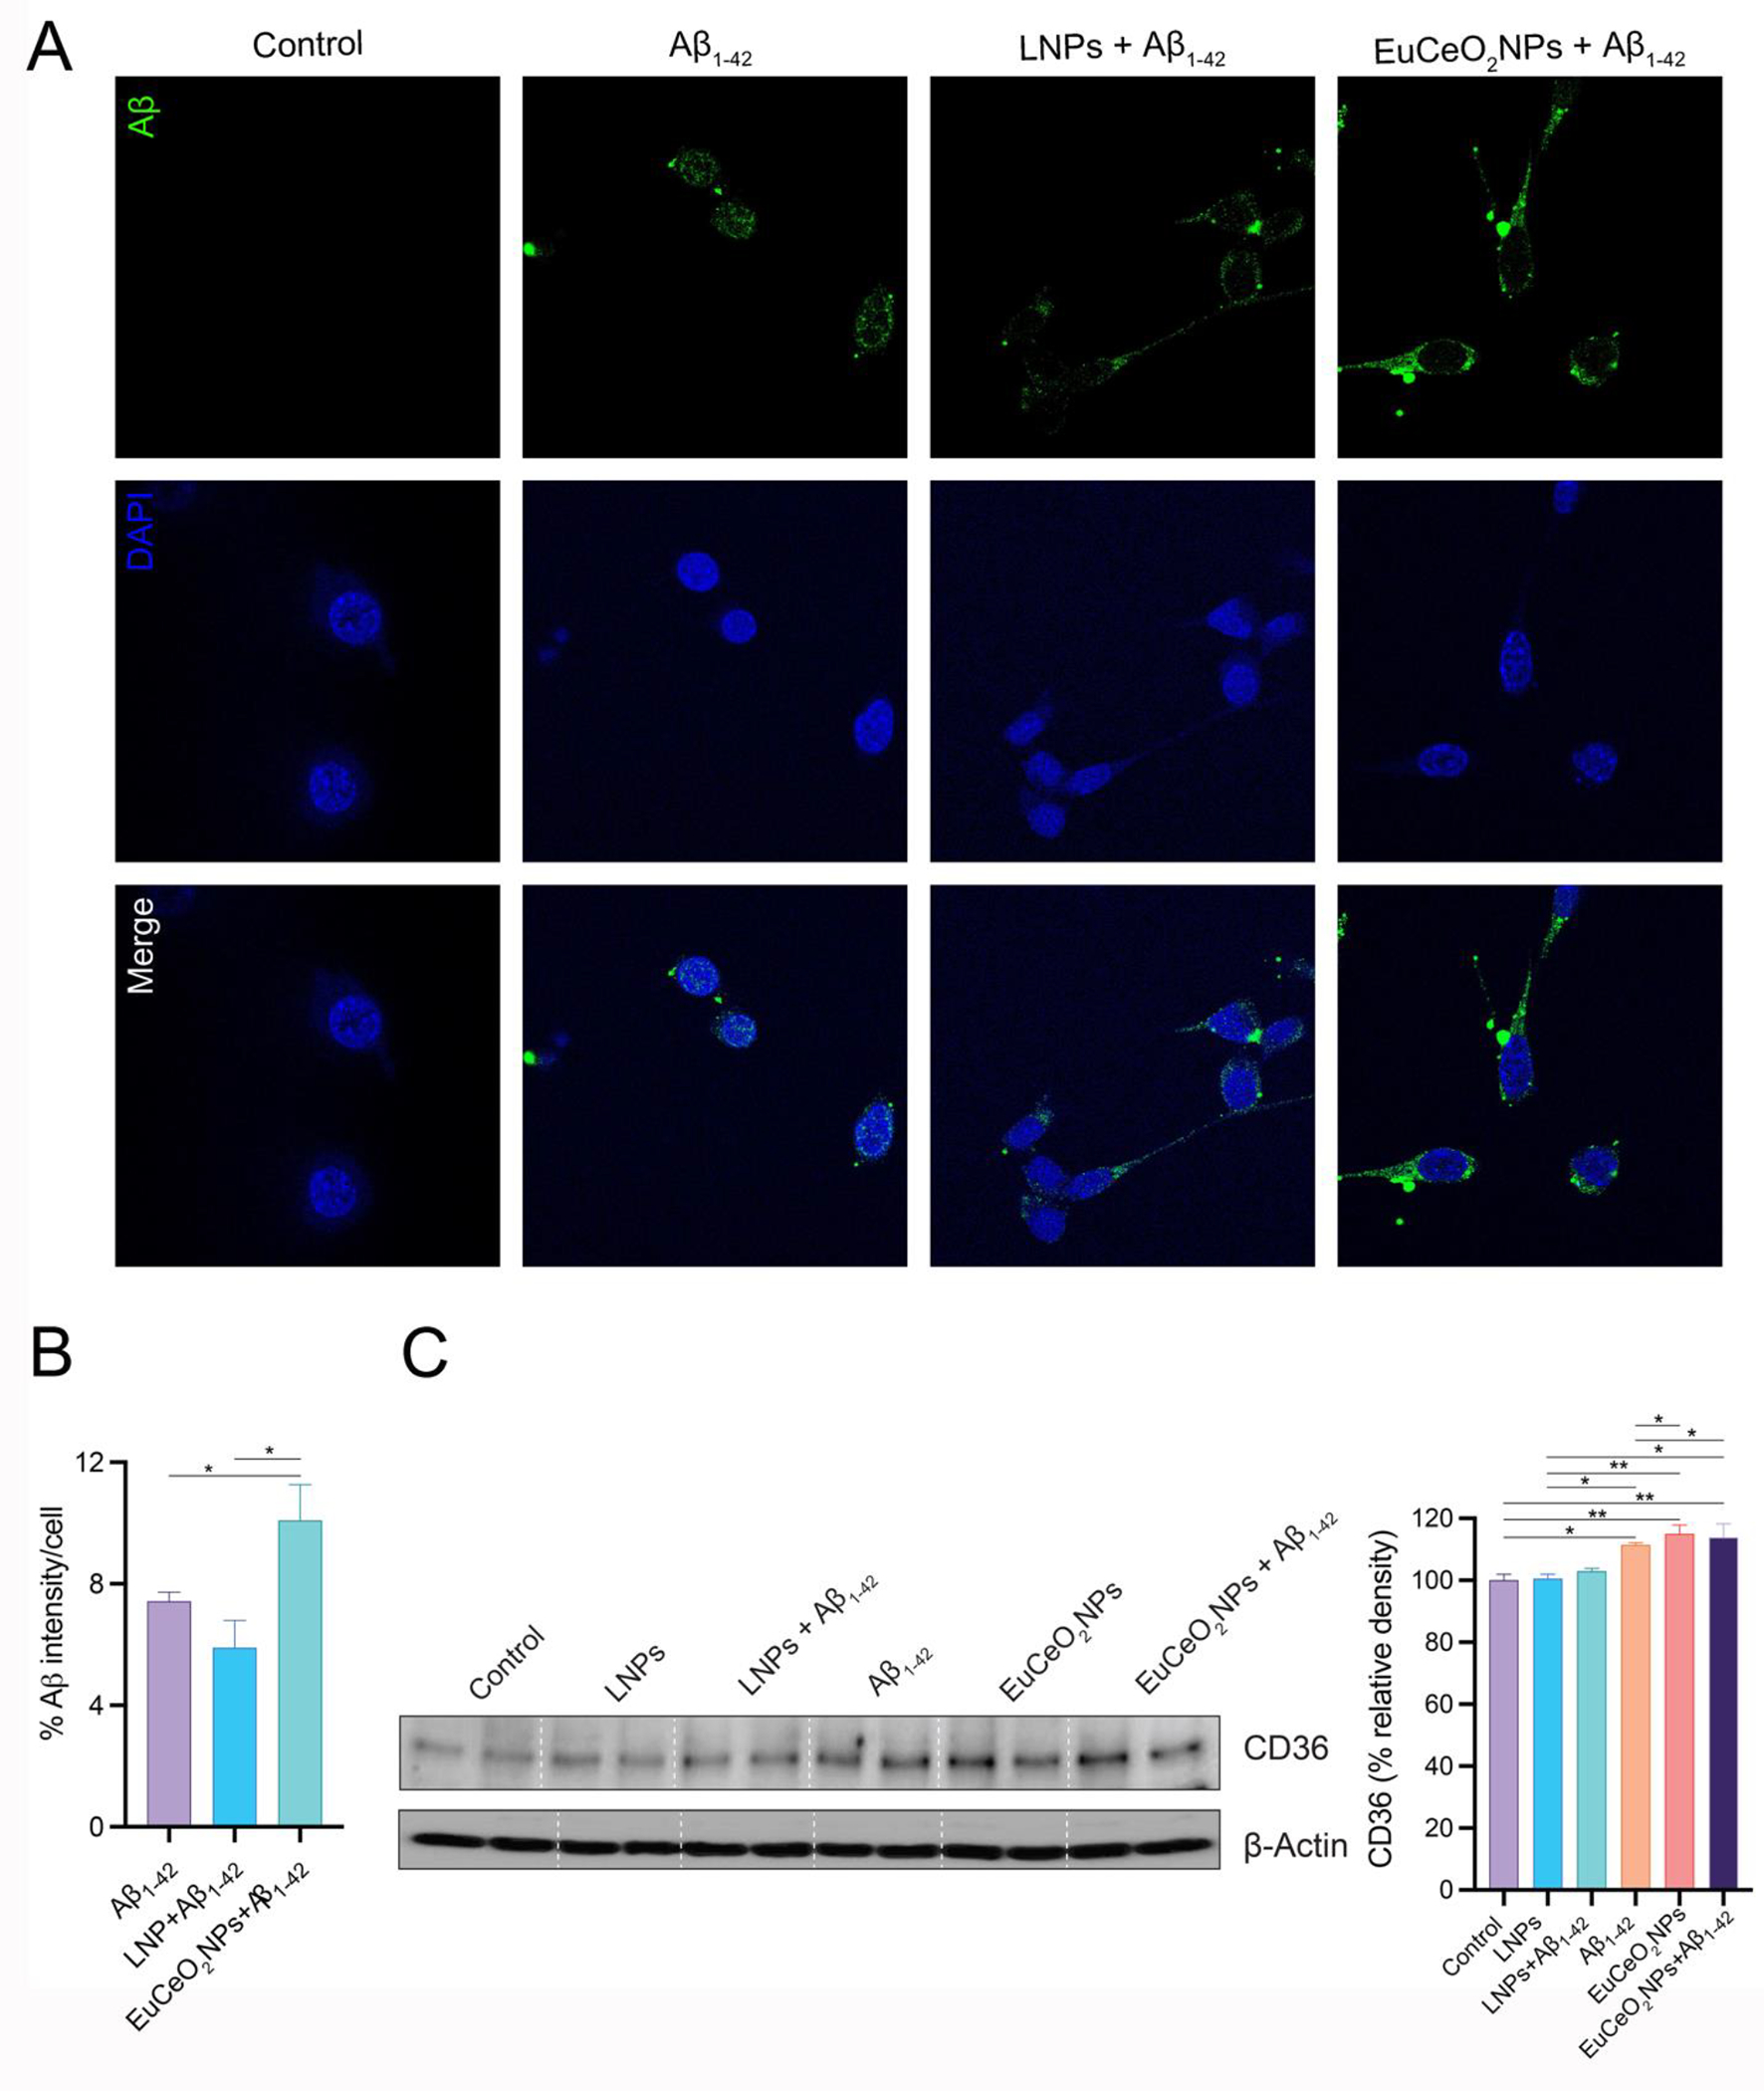
(a) BV2 cells treated with either EuCeO2NPs (100 ng/ml) or LNPs for 1 hr followed by Aβ1–42 (10 μM) exposure for additional hr and visualized using intracellular immunofluorescence staining. Immunofluorescent images of Aβ (green), nuclear stain DAPI (blue) and merged images are shown. Scale bar=10 μm. (B) Dense intensity of Aβ fluorescence was measured using ImageJ software. Experiments were performed in triplicate. One-way ANOVA followed by Newman–Keuls post-hoc test was used to determine statistical significance. *p < 0.05. (C) Immunoblot images of CD36 normalized to β-actin expression in BV2 cells after sequential EuCeO2NPs and Aβ1–42 treatment. Densitometric quantification of CD36 expression was performed using ImageJ software. n = 4. One-way ANOVA followed by Newman–Keuls post-hoc test was used to determine statistical significance. *p < 0.05, **p < 0.01.