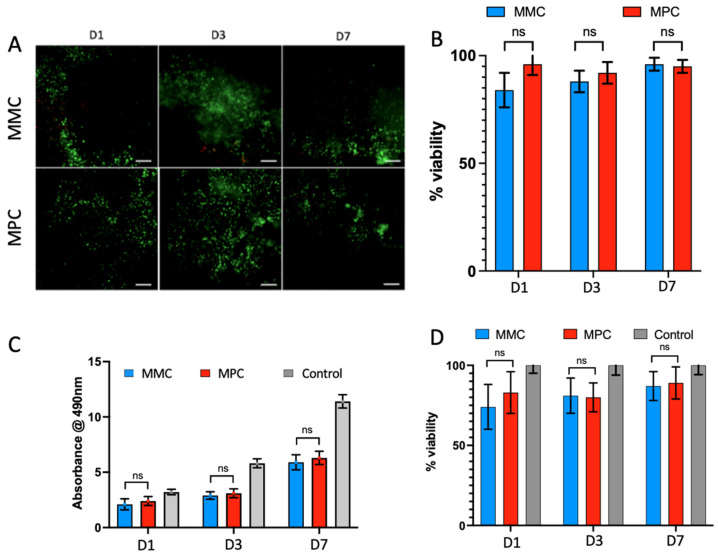
Figure 5.
Cell viability of encapsulated L929 fibroblasts in crosslinked MMC and MPC collagen hydrogels. (A) Representative images of bioscaffolds stained with live/dead (calcein AM, ethidium homodimer-1) at the 3 different indicated time points (D1, 3 and 7). Scale bar is 100 µm. (B) The graph shows the cell viability obtained from the live/dead stained samples, calculated as the percentage of live: dead cells. (C) The graph shows the metabolic activity of the cells in the bioprinted scaffolds evaluated with MTS assay and absorbance readings at 490 nm. (D) Cell viability calculated from MTS assay, normalised to standard curve of 2D cultured cells. Results of the t-test indicate no significant difference between MMC and MPC at each timepoint in both the calcein-AM and ethidium homodimer-1 staining, as well as the MTS assay. ns: No statistical significance was observed between MMC and MPC at each timepoint.

