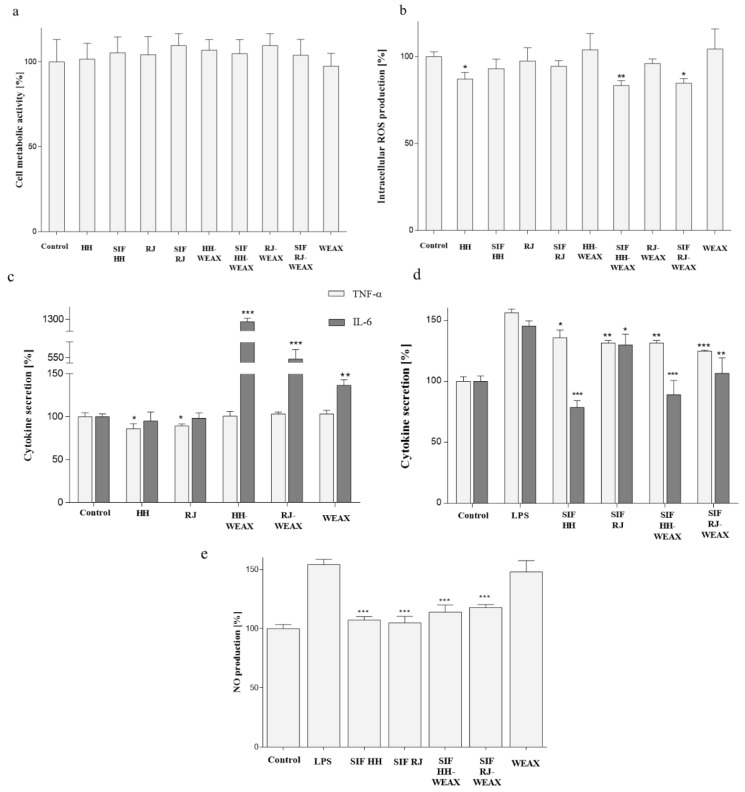
Figure 6.
The influence of honey, royal jelly, encapsulated bee products and WEAX biopolymers at 0.15 mg mL−1 concentration on RAW 264.7 cells’ (a) metabolic activity determined with PrestoBlue assay; (b) intracellular ROS level determined with DCF assay; (c) IL-6 and TNF-α secretion determined with ELISA assay without treatment with LPS and (d) in cells stimulated with LPS; (e) NO release in LPS-stimulated cells determined with Griess reagent after 24 h incubation. Small intestine fraction (SIF) samples treated with in vitro intestinal digestion. Each value on the graphs represents the mean value ± SEM, n ≥ 3. Significance of differences between means * p < 0.05, ** p < 0.01, *** p < 0.001 versus control cells (a–c) or LPS-stimulated cells (d,e).

