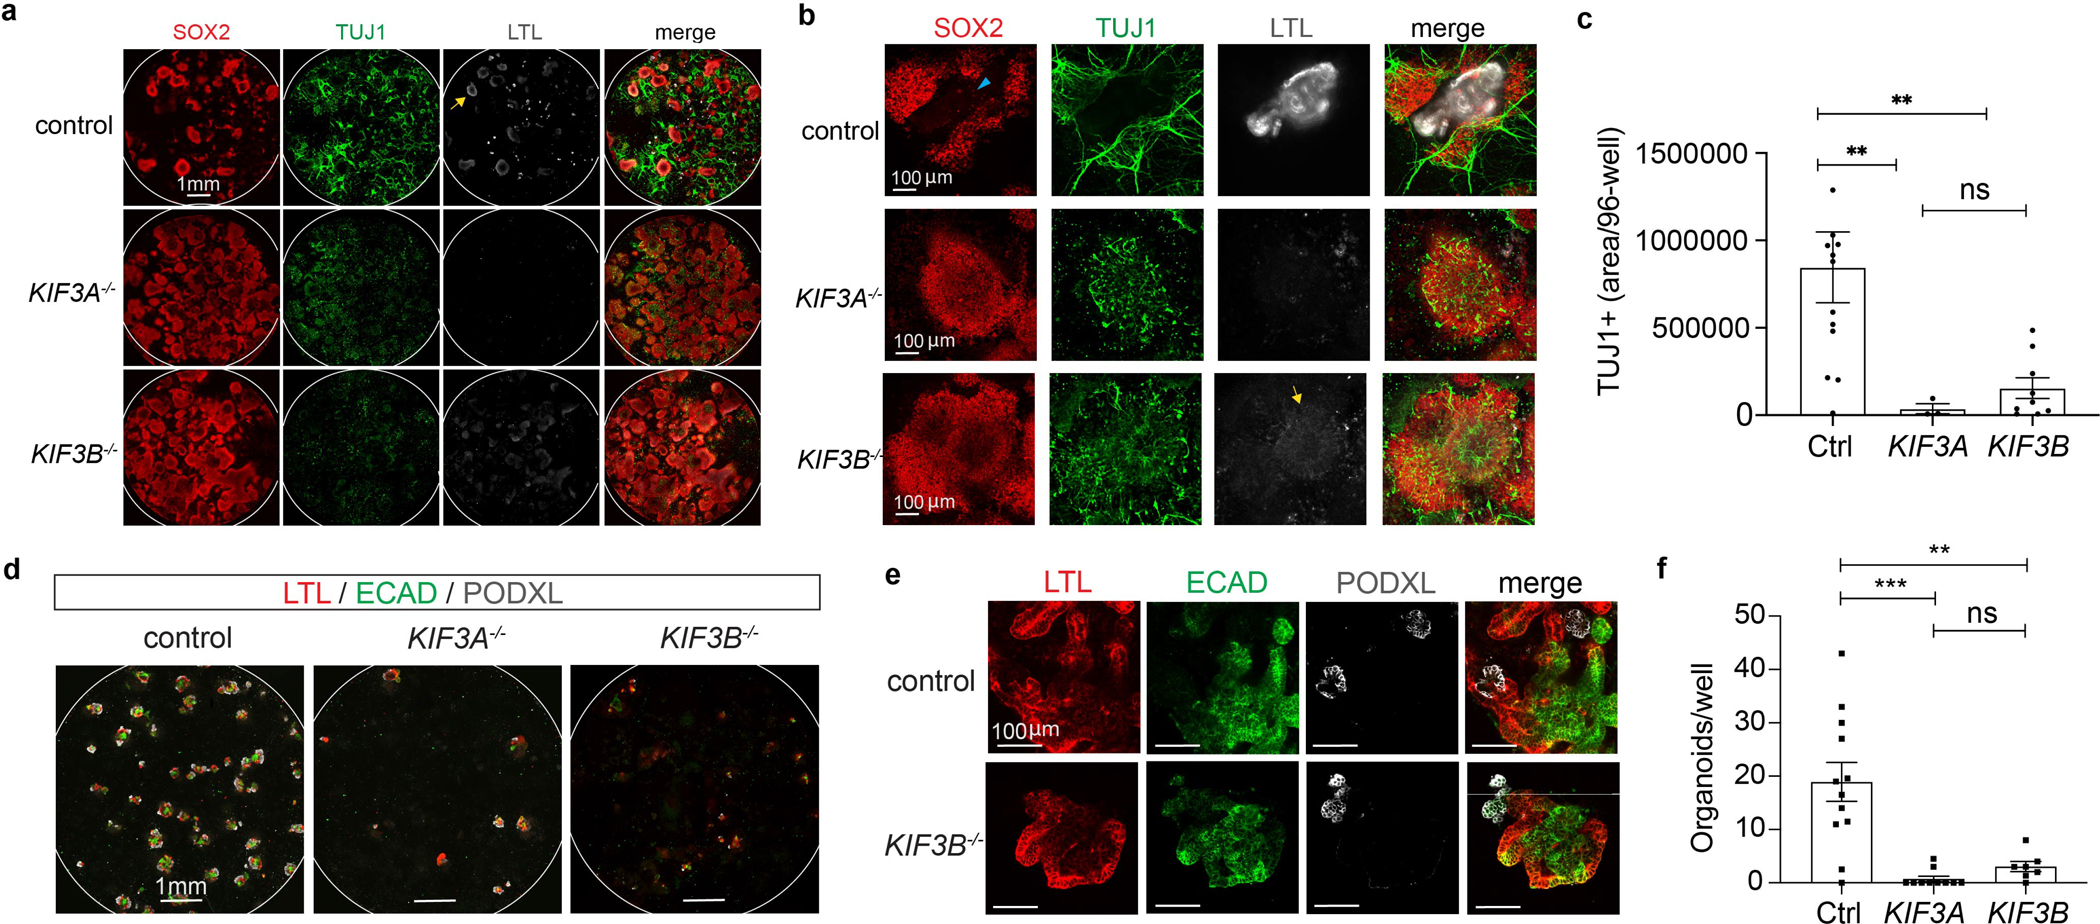
Fig. 4. KIF3A−/− and KIF3B−/− kidney organoids express defects in neuronal and nephron differentiation.

(a) Representative confocal immunofluorescence for markers of neurons and proximal tubules in control, KIF3A−/−, and KIF3B−/− kidney organoid cultures, showing whole 96-wells or (b) higher-magnification fields. A small minority of SOX2+ cells are found in proximal tubules (cyan arrowhead). In addition to tubules, fainter LTL staining is observed in neuroepithelial structures (yellow arrows). (c) Quantification of TUJ1+ neuron area in these 96-wells (mean ± s.e.m., n ≥ 3 independent biological replicates per condition from a total of 11 distinct cell lines. **, p < 0.01). (d) Confocal immunofluorescence images of nephron markers in kidney organoid differentiations in representative 96-well plates and (e) higher magnification. Each kidney organoid contains distal tubular (ECAD+), proximal tubular (LTL+), and podocyte (PODXL+) epithelial cells. (f) Quantification of kidney organoid differentiation in these lines (mean ± s.e.m., n ≥ 7 independent biological replicates per condition from a total of 13 distinct cell lines. **, p < 0.01; ***, p < 0.001).
