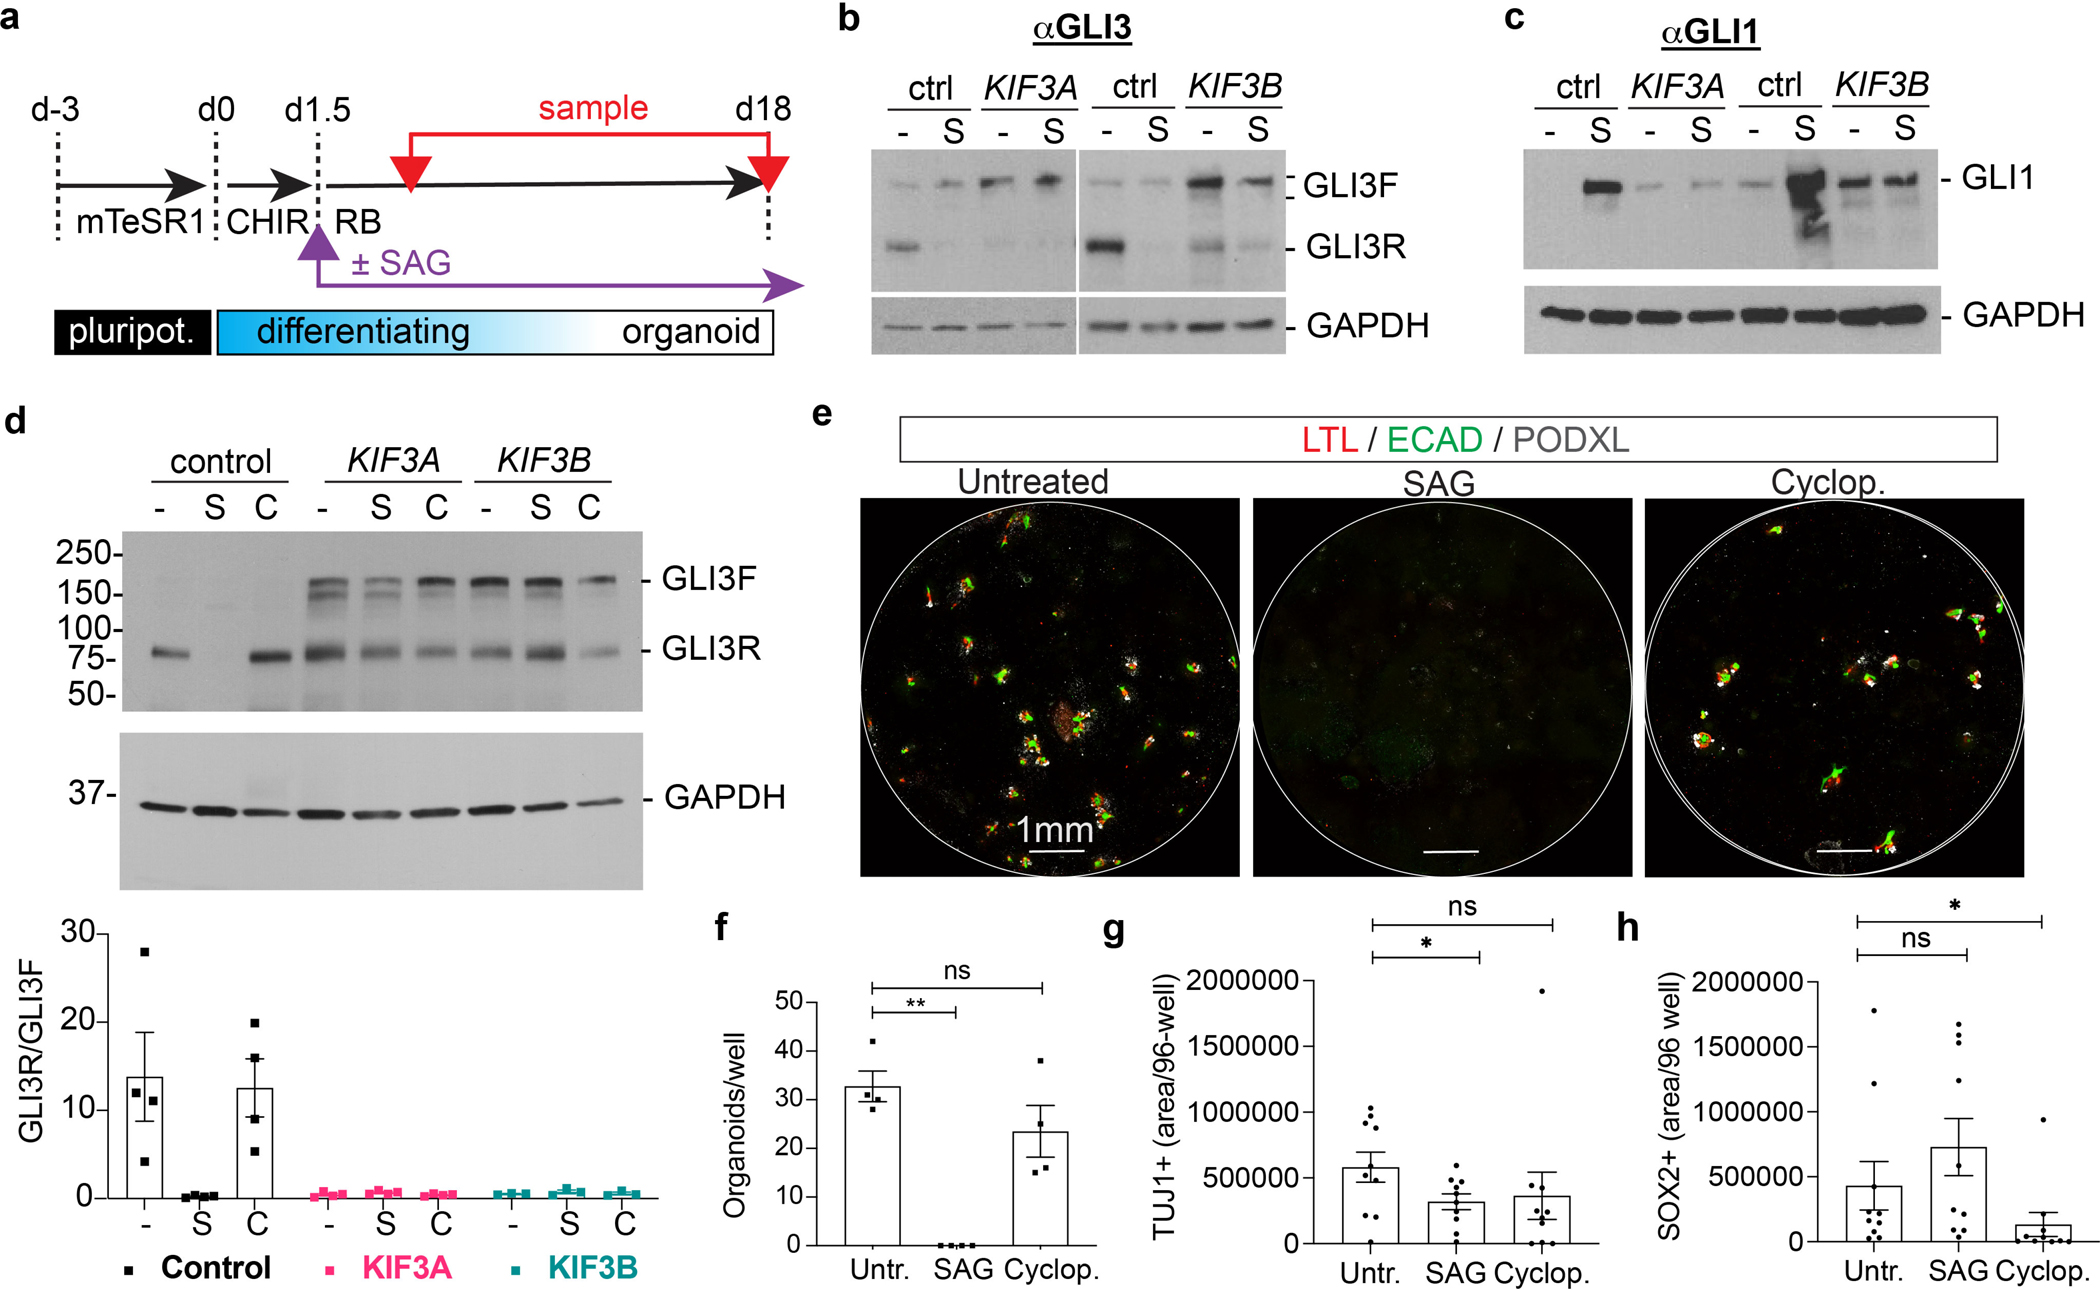
Fig. 6. Smoothened agonist perturbs organoid differentiation.

(a) Schematic of organoid differentiation time course, indicating initiation of SAG treatment (purple arrow) and sampling time points (red arrows). (b) Representative GLI3 and (c) GLI1 immunoblots of cultures on day 7 differentiation, under standard conditions (−) or supplemented with 1 μM SAG (S) starting on day 1.5 of differentiation. (d) Representative GLI3 immunoblot of control, KIF3A−/−, and KIF3B−/− organoid lysates on day 18 of differentiation. For each genotype, conditions were untreated (−), + 1 μM SAG (S), or + 10 μM cyclopamine (C) starting on day 1.5 of differentiation. Graph below the blot shows quantification of GLI3 immunoblot band intensities (mean ± s.e.m., n ≥ 3 independent biological replicates per condition from a total of 8 distinct cell lines). (e) Representative whole 96-well confocal immunofluorescence images of kidney organoid cultures derived from control hPSCs, showing nephron marker expression in these treatment conditions. (f) Quantification of nephron organoids per well in control hPSCs with hedgehog treatments (mean ± s.e.m., n = 4 independent biological replicates per condition from a total of 4 distinct cell lines; **, p < 0.01). (g) Quantification of TUJ1+ and (h) SOX2+ area in control 96 wells ± SAG (mean ± s.e.m., n = 10 independent biological replicates per condition from a total of 4 distinct cell lines. *, p < 0.05).
