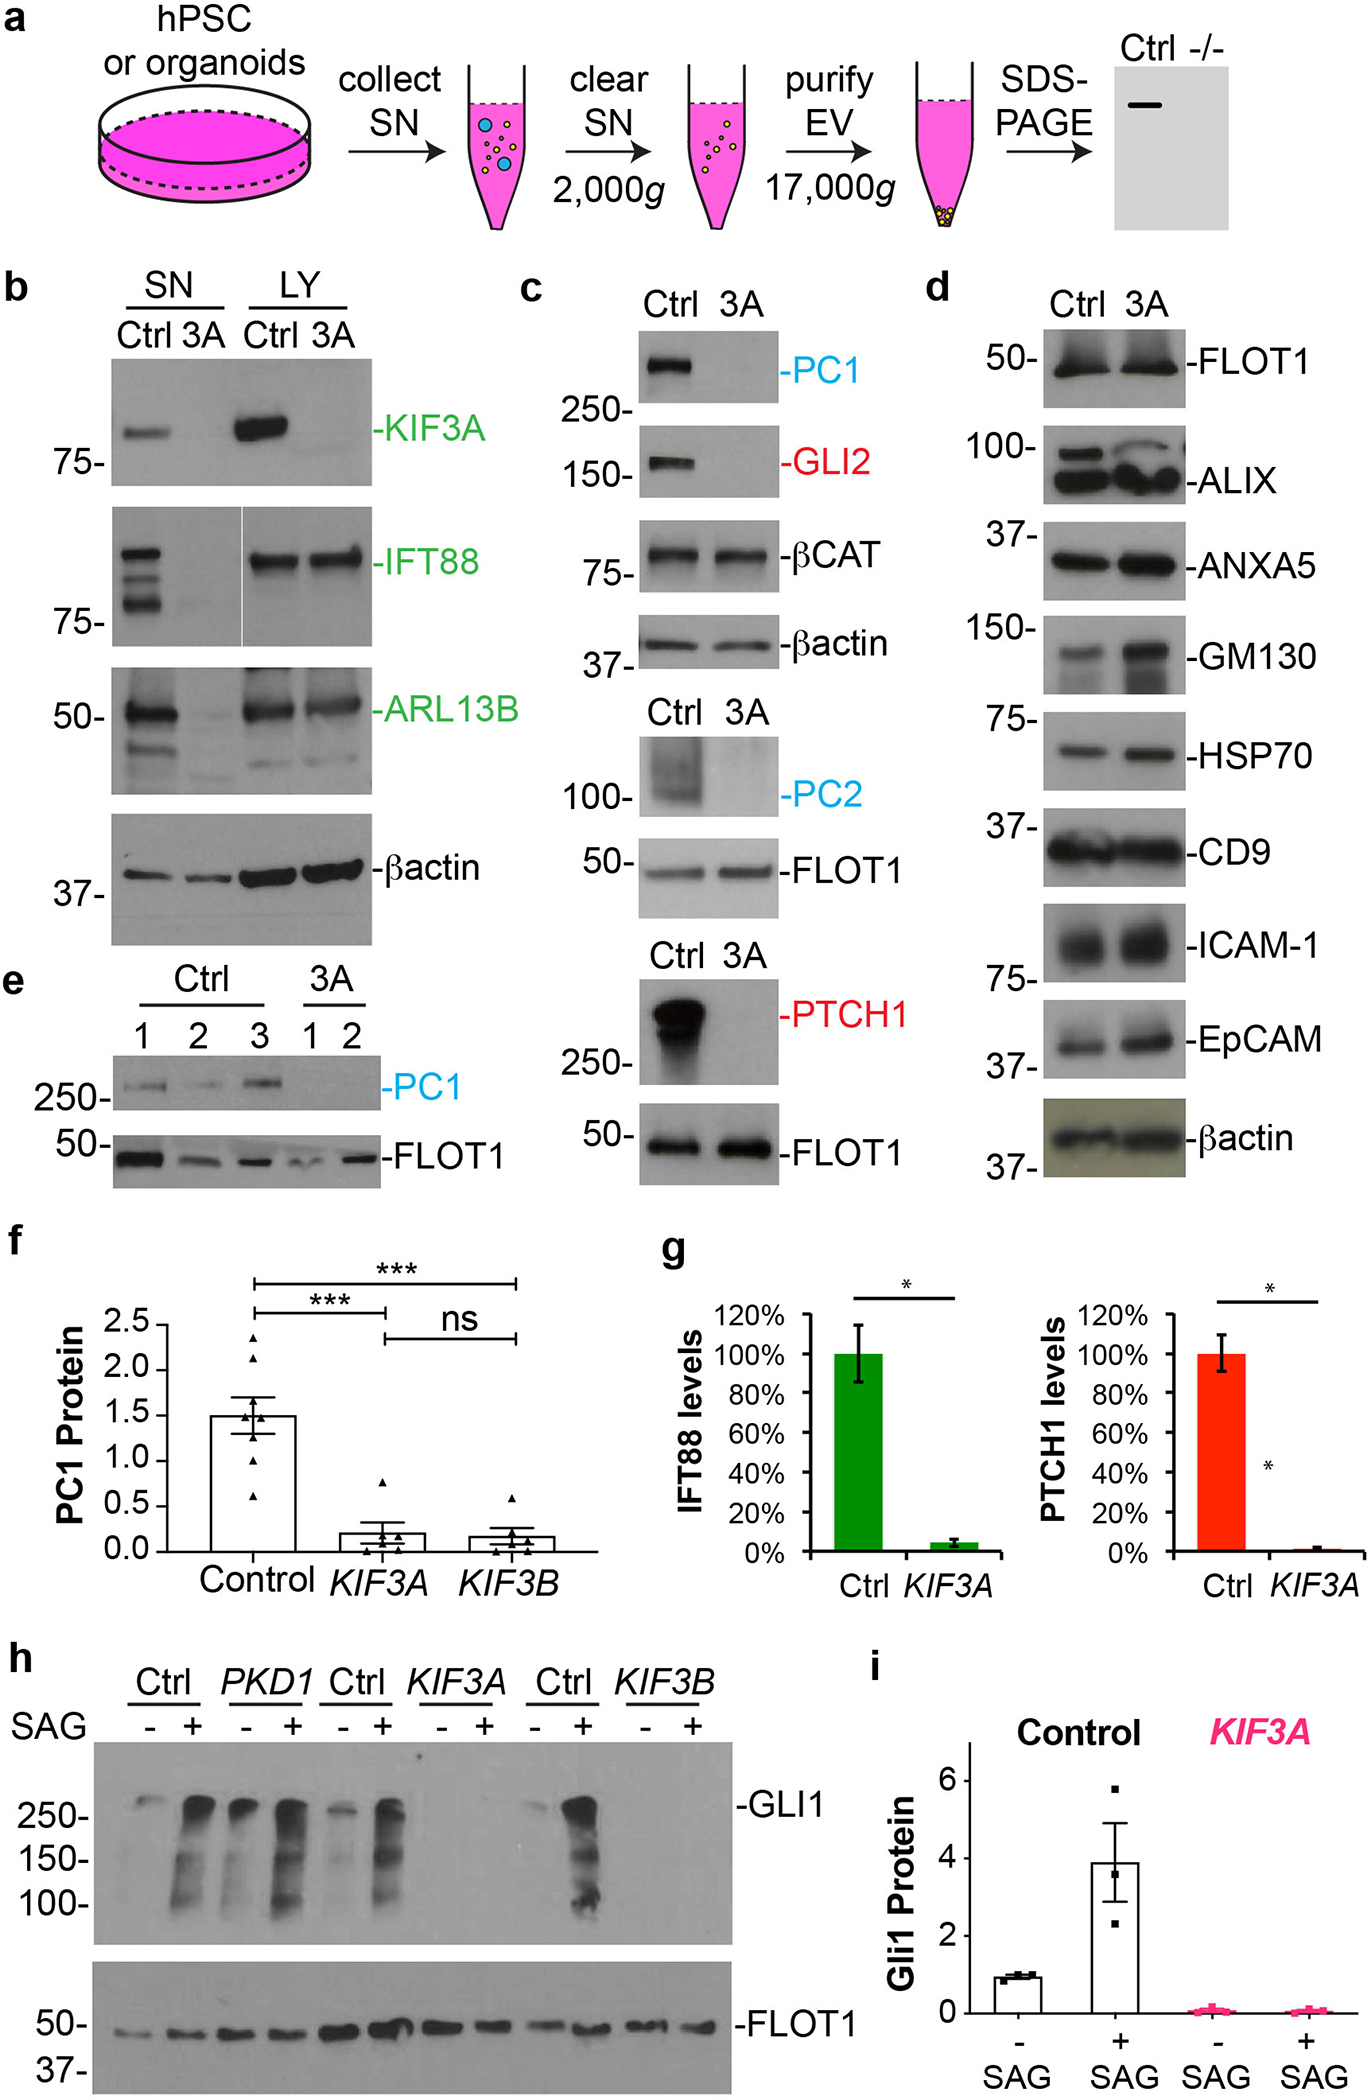
Fig. 8. Kinesin-2 knockout hPSCs and organoids reveal secretion defects in disease-relevant signaling pathways.

(a) Schematic of EV purification and analysis experiment. (b) Representative immunoblots of endogenous ciliary proteins (green type) in supernatants (SN) and lysates (LY) from control and KIF3A−/− hPSCs. β-actin is shown as a loading control. (c) Immunoblots of supernatants showing key components of the PKD (blue type) and hedgehog (red type) pathways in these supernatants. β-actin, β-catenin, and flotillin (FLOT1) are shown as loading controls. (d) A panel of non-ciliary EV components in supernatants. (e) PC1 expression in the supernatants of kidney organoids in suspension. Three control and two KIF3A−/− lines are shown. (f) Quantification of PC1 in EVs from control and mutant hPSCs (mean ± s.e.m., n ≥ 6 biological replicates per condition, total of 14 distinct cell lines. ***, p < 0.001). (g) Quantification of IFT88, PC1, and PTCH1 in EVs from control and mutant hPSCs (n = 4 biological replicates, p < 0.01). (h) Representative immunoblots of EV from control, PKD1−/−, and kinesin-2 knockout hPSCs, ± SAG treatment, with (i) quantification (mean ± s.e.m., n = 3 biological replicates per condition, total of 6 distinct cell lines).
