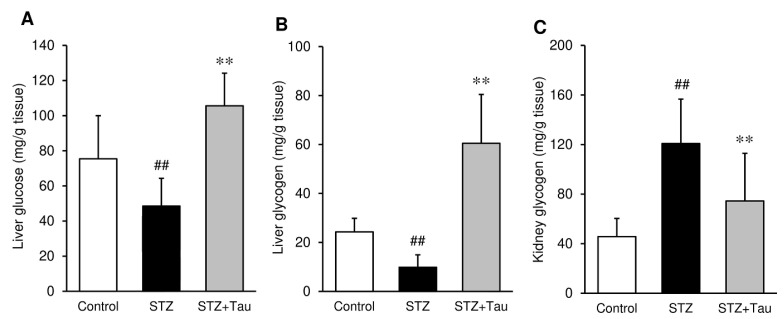
Figure 3.
Effects of taurine supplementation on the glucose and glycogen content in the liver and kidney in diabetic mice. (A) Liver glucose, (B) Liver glycogen, (C) Kidney glycogen. Glucose and glycogen levels were measured using commercially available kits. Each value is expressed as the mean ± S.D. (n = 7–8). ## p < 0.01 vs Control group, ** p < 0.01 vs. STZ group.

