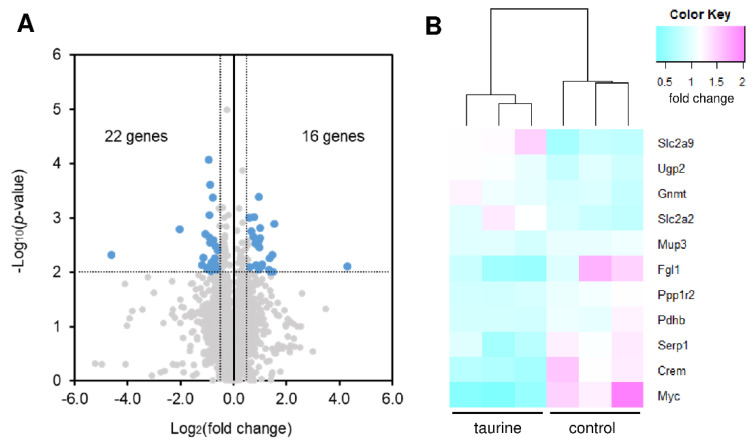
Figure 5.
Microarray analysis in the liver from taurine-treated mice. (A) Volcano plots showing the differential expression patterns between taurine-treated and control groups. (B) Heat maps showing the differentially expressed genes (p < 0.05) annotated with GO term for glycogen biosynthesis (GO: 0005978), glucose metabolic process (GO: 0006006), UDP-glucose metabolic process (GO: 0006011) and glucose transport (GO: 0046323) in the liver between taurine-treated and control mice.

