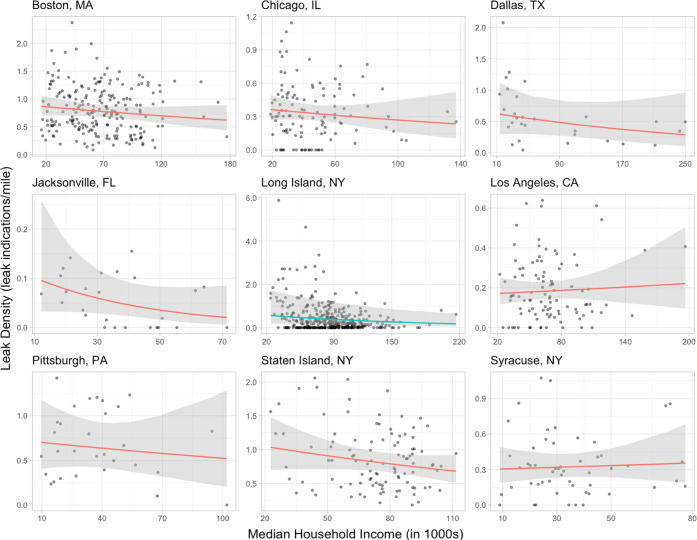
Figure 4.
Relationship between median household income (in US dollars) and leak density from surveyed census tracts in each of nine of the metro areas. In seven of the nine metro areas, leak density is estimated to decrease with increasing income. In Long Island (blue line), there was statistical evidence to conclude that leak density decreases with increasing income. Note that the x- and y-axes vary across metro areas.

