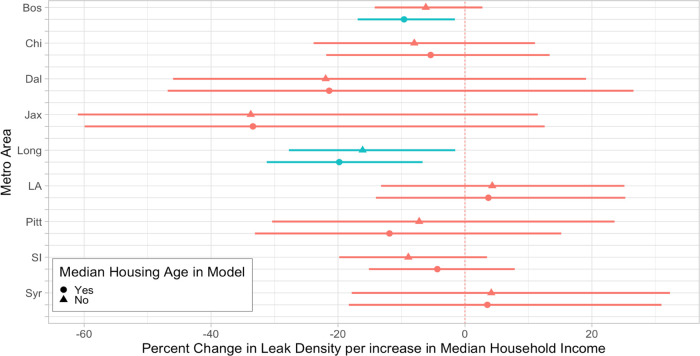
Figure 6.
Estimated relationship (i.e., slope) between median household income and leak density with and without median housing age in the model. The x-axis shows the estimated percent change in leak density associated with a one-standard deviation additional difference in median income. Blue credible intervals do not contain zero, indicating that there is statistical evidence of a relationship between median household income and leak density in the corresponding metro area.

