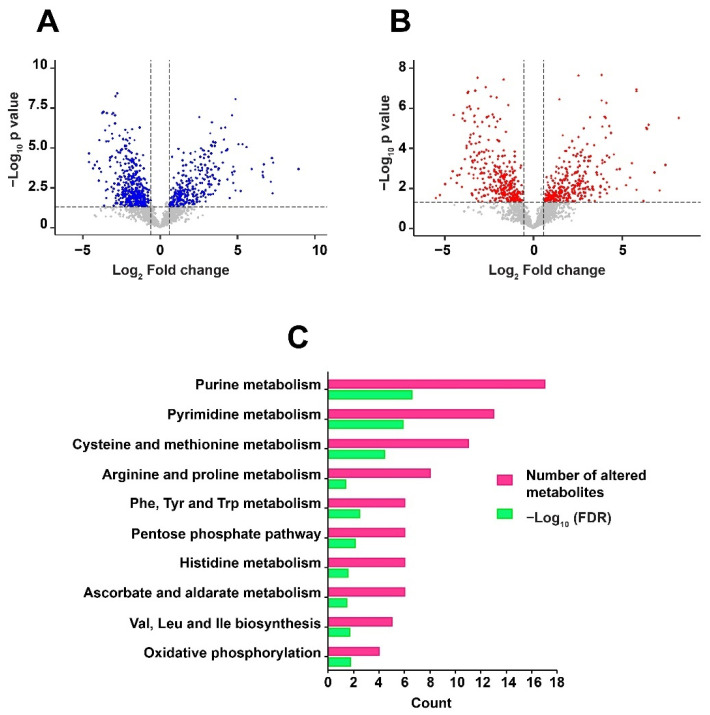
Figure 3.
Volcano plots show the distribution of significantly altered metabolites in: (A) Positive mode and (B) Negative mode. The dotted line on X-axis represents p-value cut off while the dotted line on Y-axis shows the fold change cut off. (C) Metabolic pathways enriched with False Discovery Rate (FDR) ≤ 0.05 against the dysregulated metabolites are shown as a horizontal multi-set bar graph. The length of bars represents the count for both FDR and the number of metabolite entities enriched per pathway.

