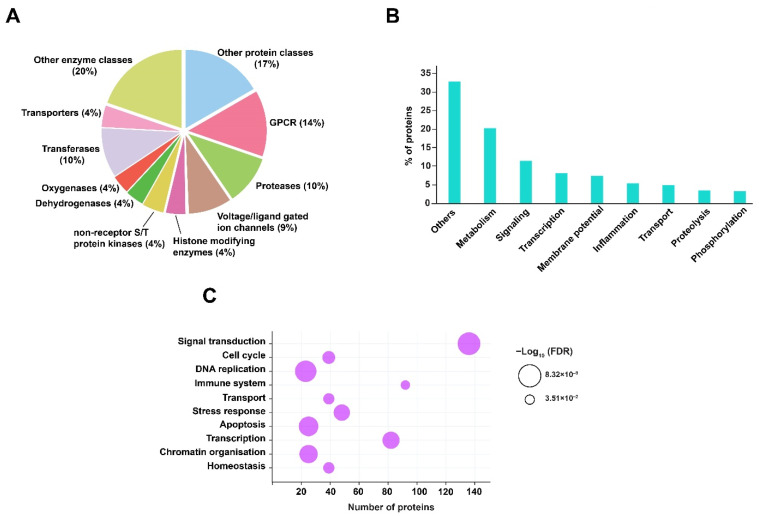
Figure 4.
GO and pathway analysis of predicted protein interactors. (A) Classification of protein targets is represented as a pie chart. (B) Biological processes are shown as a vertical bar graph. (C) Pathway analysis is represented as a bubble plot. The size of the bubble signifies the FDR value (≤0.05).

